Warning: package 'ggplot2' was built under R version 4.5.2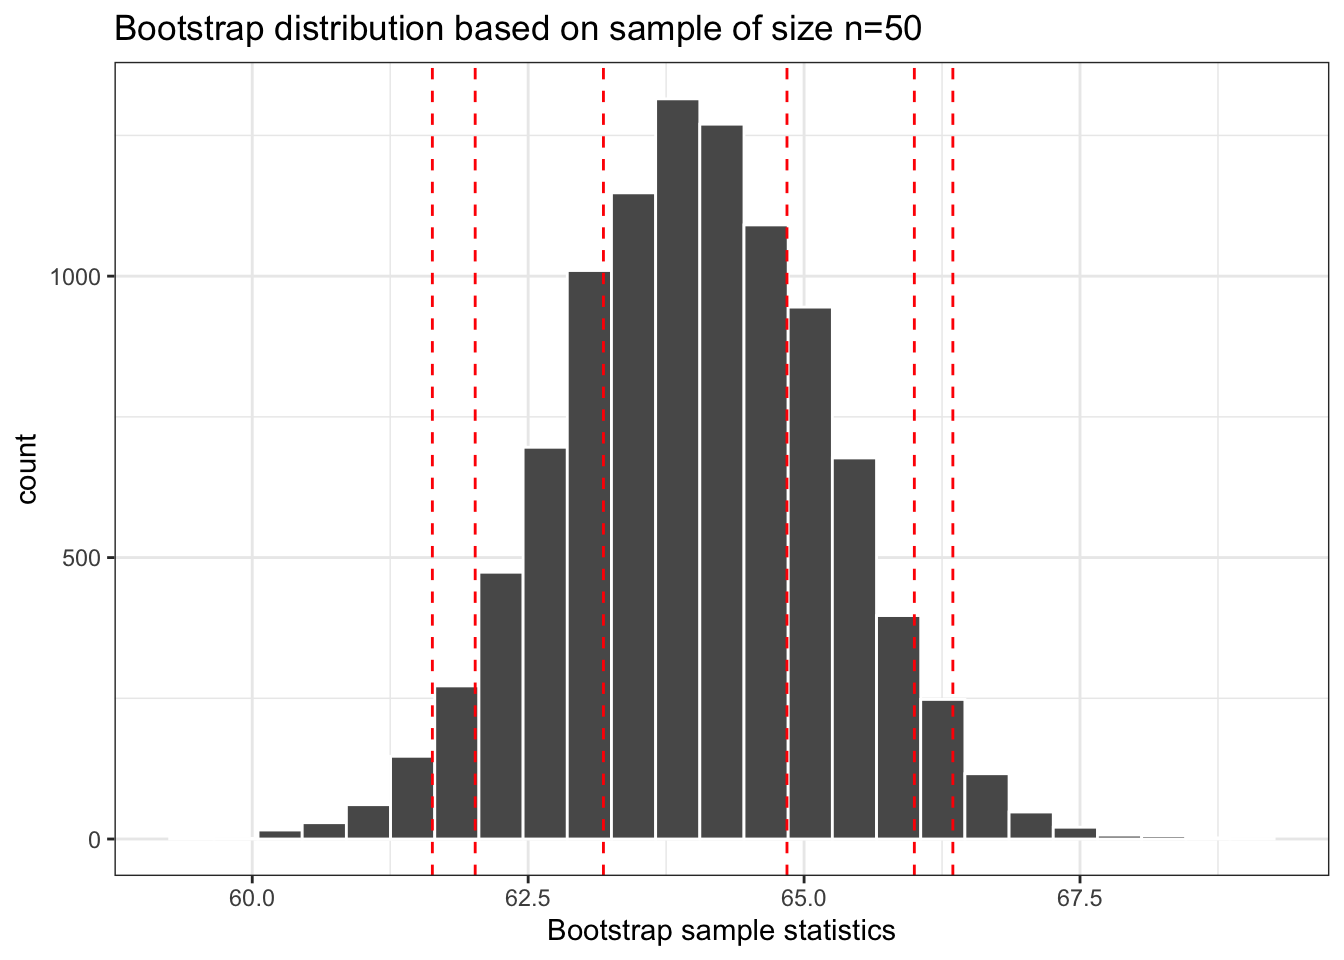
  2.5%     5%    25%    75%    95%  97.5%
61.584 61.963 63.168 64.785 65.974 66.351 Before coming to lecture today, please read the following material:
Supposed you’d like to know the average height of all Reedies (\(\mu\)). To help figure it out, you’ve collected a sample of 50 Reedies and measured their heights. You find that the sample mean \(\overline{x} = 64\) inches. Based on your sample, suppose you calculate a bootstrap distribution based on 10,000 re-samples from your sample. The bootstrap distribution is shown below, as well as the 0.025, 0.05, 0.25, 0.75, 0.95, and 0.975 quantiles of the bootstrap distribution (shown as vertical lines in the histogram as well).
Warning: package 'ggplot2' was built under R version 4.5.2
2.5% 5% 25% 75% 95% 97.5%
61.584 61.963 63.168 64.785 65.974 66.351 Based on the histogram and table of quantiles, write down an appropriate confidence interval based on a (i) 95% confidence level, (ii) 90% confidence interval, and (iii) 50% confidence interval. Also, interpret one of these confidence intervals in the context of the data.