| ID | kind | .pred_AI | .pred_class | detector | native | name | model |
|---|---|---|---|---|---|---|---|
| 1 | Human | 0.9999942 | AI | Sapling | No | Real TOEFL | Human |
| 2 | Human | 0.8281448 | AI | Crossplag | No | Real TOEFL | Human |
| 3 | Human | 0.0002137 | Human | Crossplag | Yes | Real College Essays | Human |
| 4 | AI | 0.0000000 | Human | ZeroGPT | NA | Fake CS224N - GPT3 | GPT3 |
| 5 | AI | 0.0017841 | Human | OriginalityAI | NA | Fake CS224N - GPT3, PE | GPT4 |
| 6 | Human | 0.0001783 | Human | HFOpenAI | Yes | Real CS224N | Human |

Data Visualization
Grayson White
Math 141
Week 1 | Fall 2025
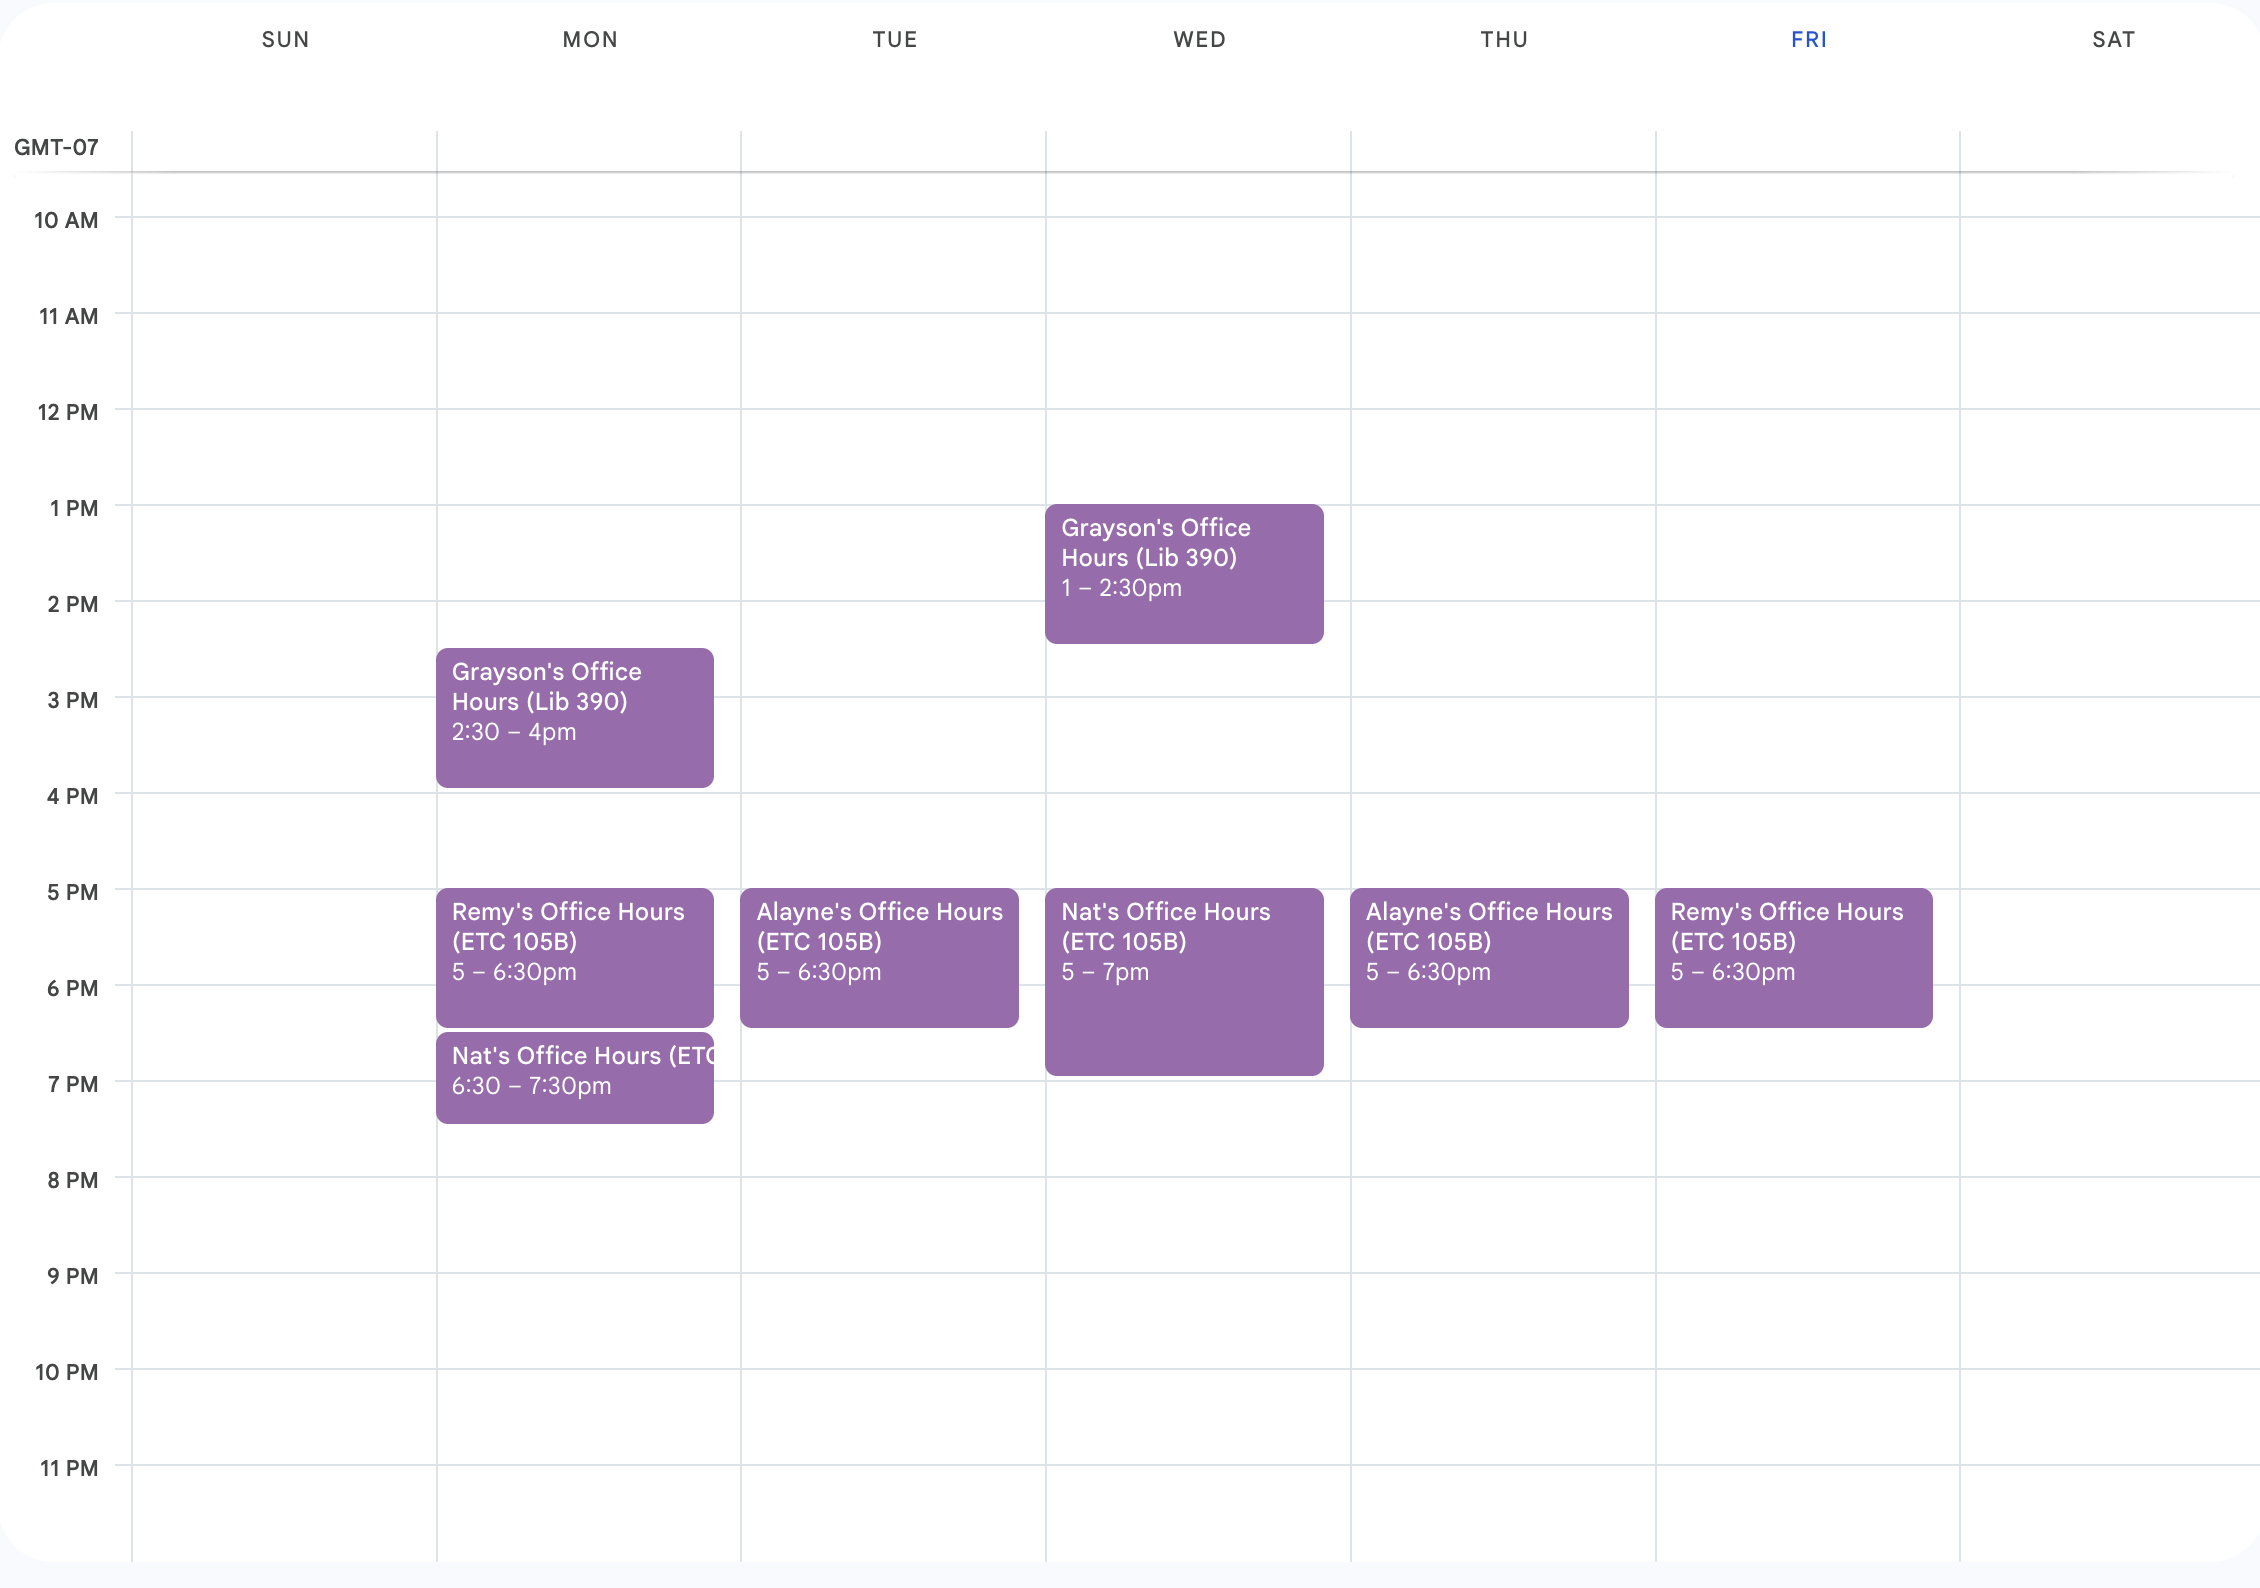
Math 141 Office Hours Schedule
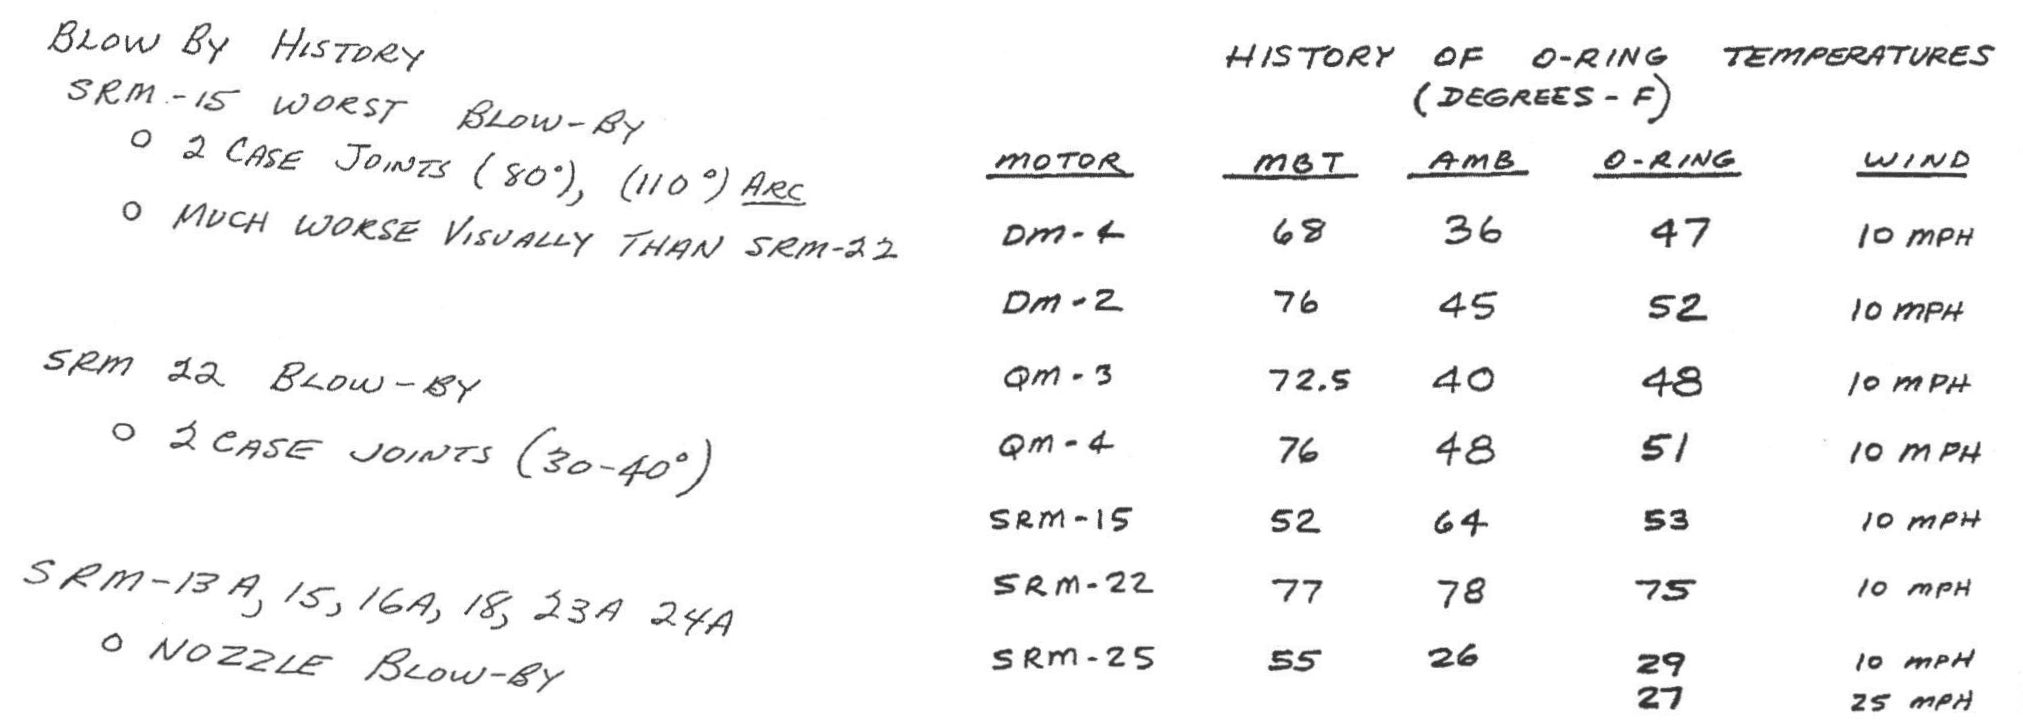
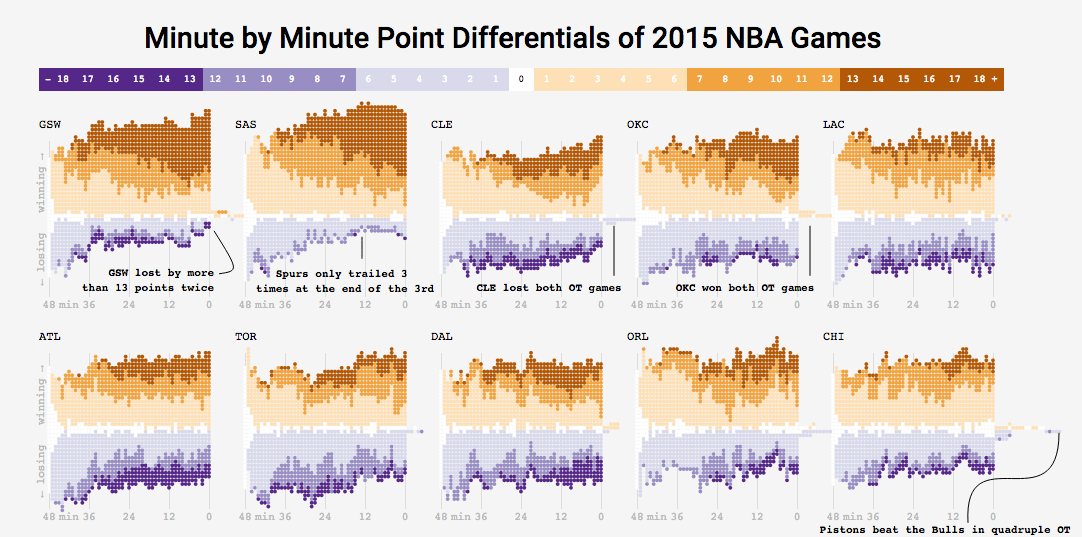
Challenger
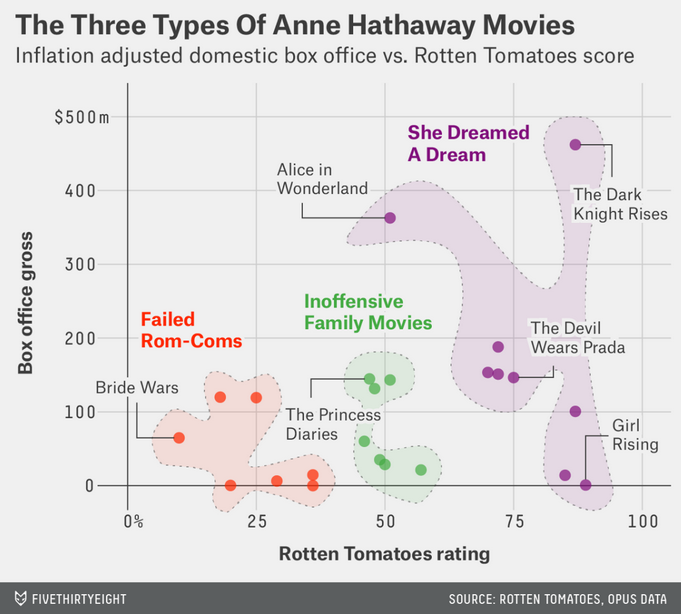
Here’s one of those charts.
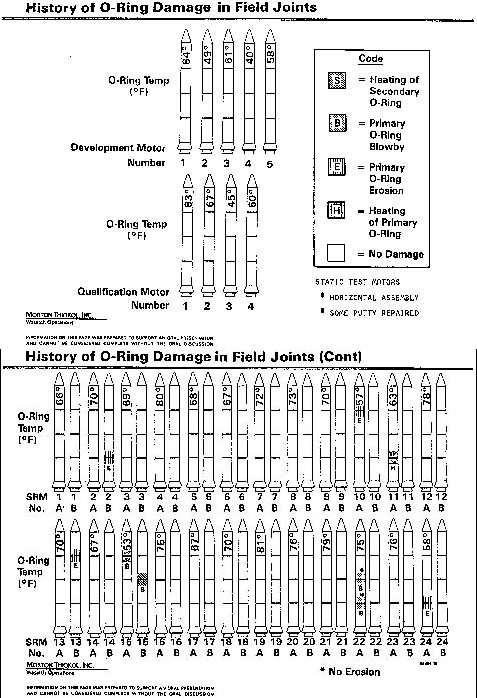
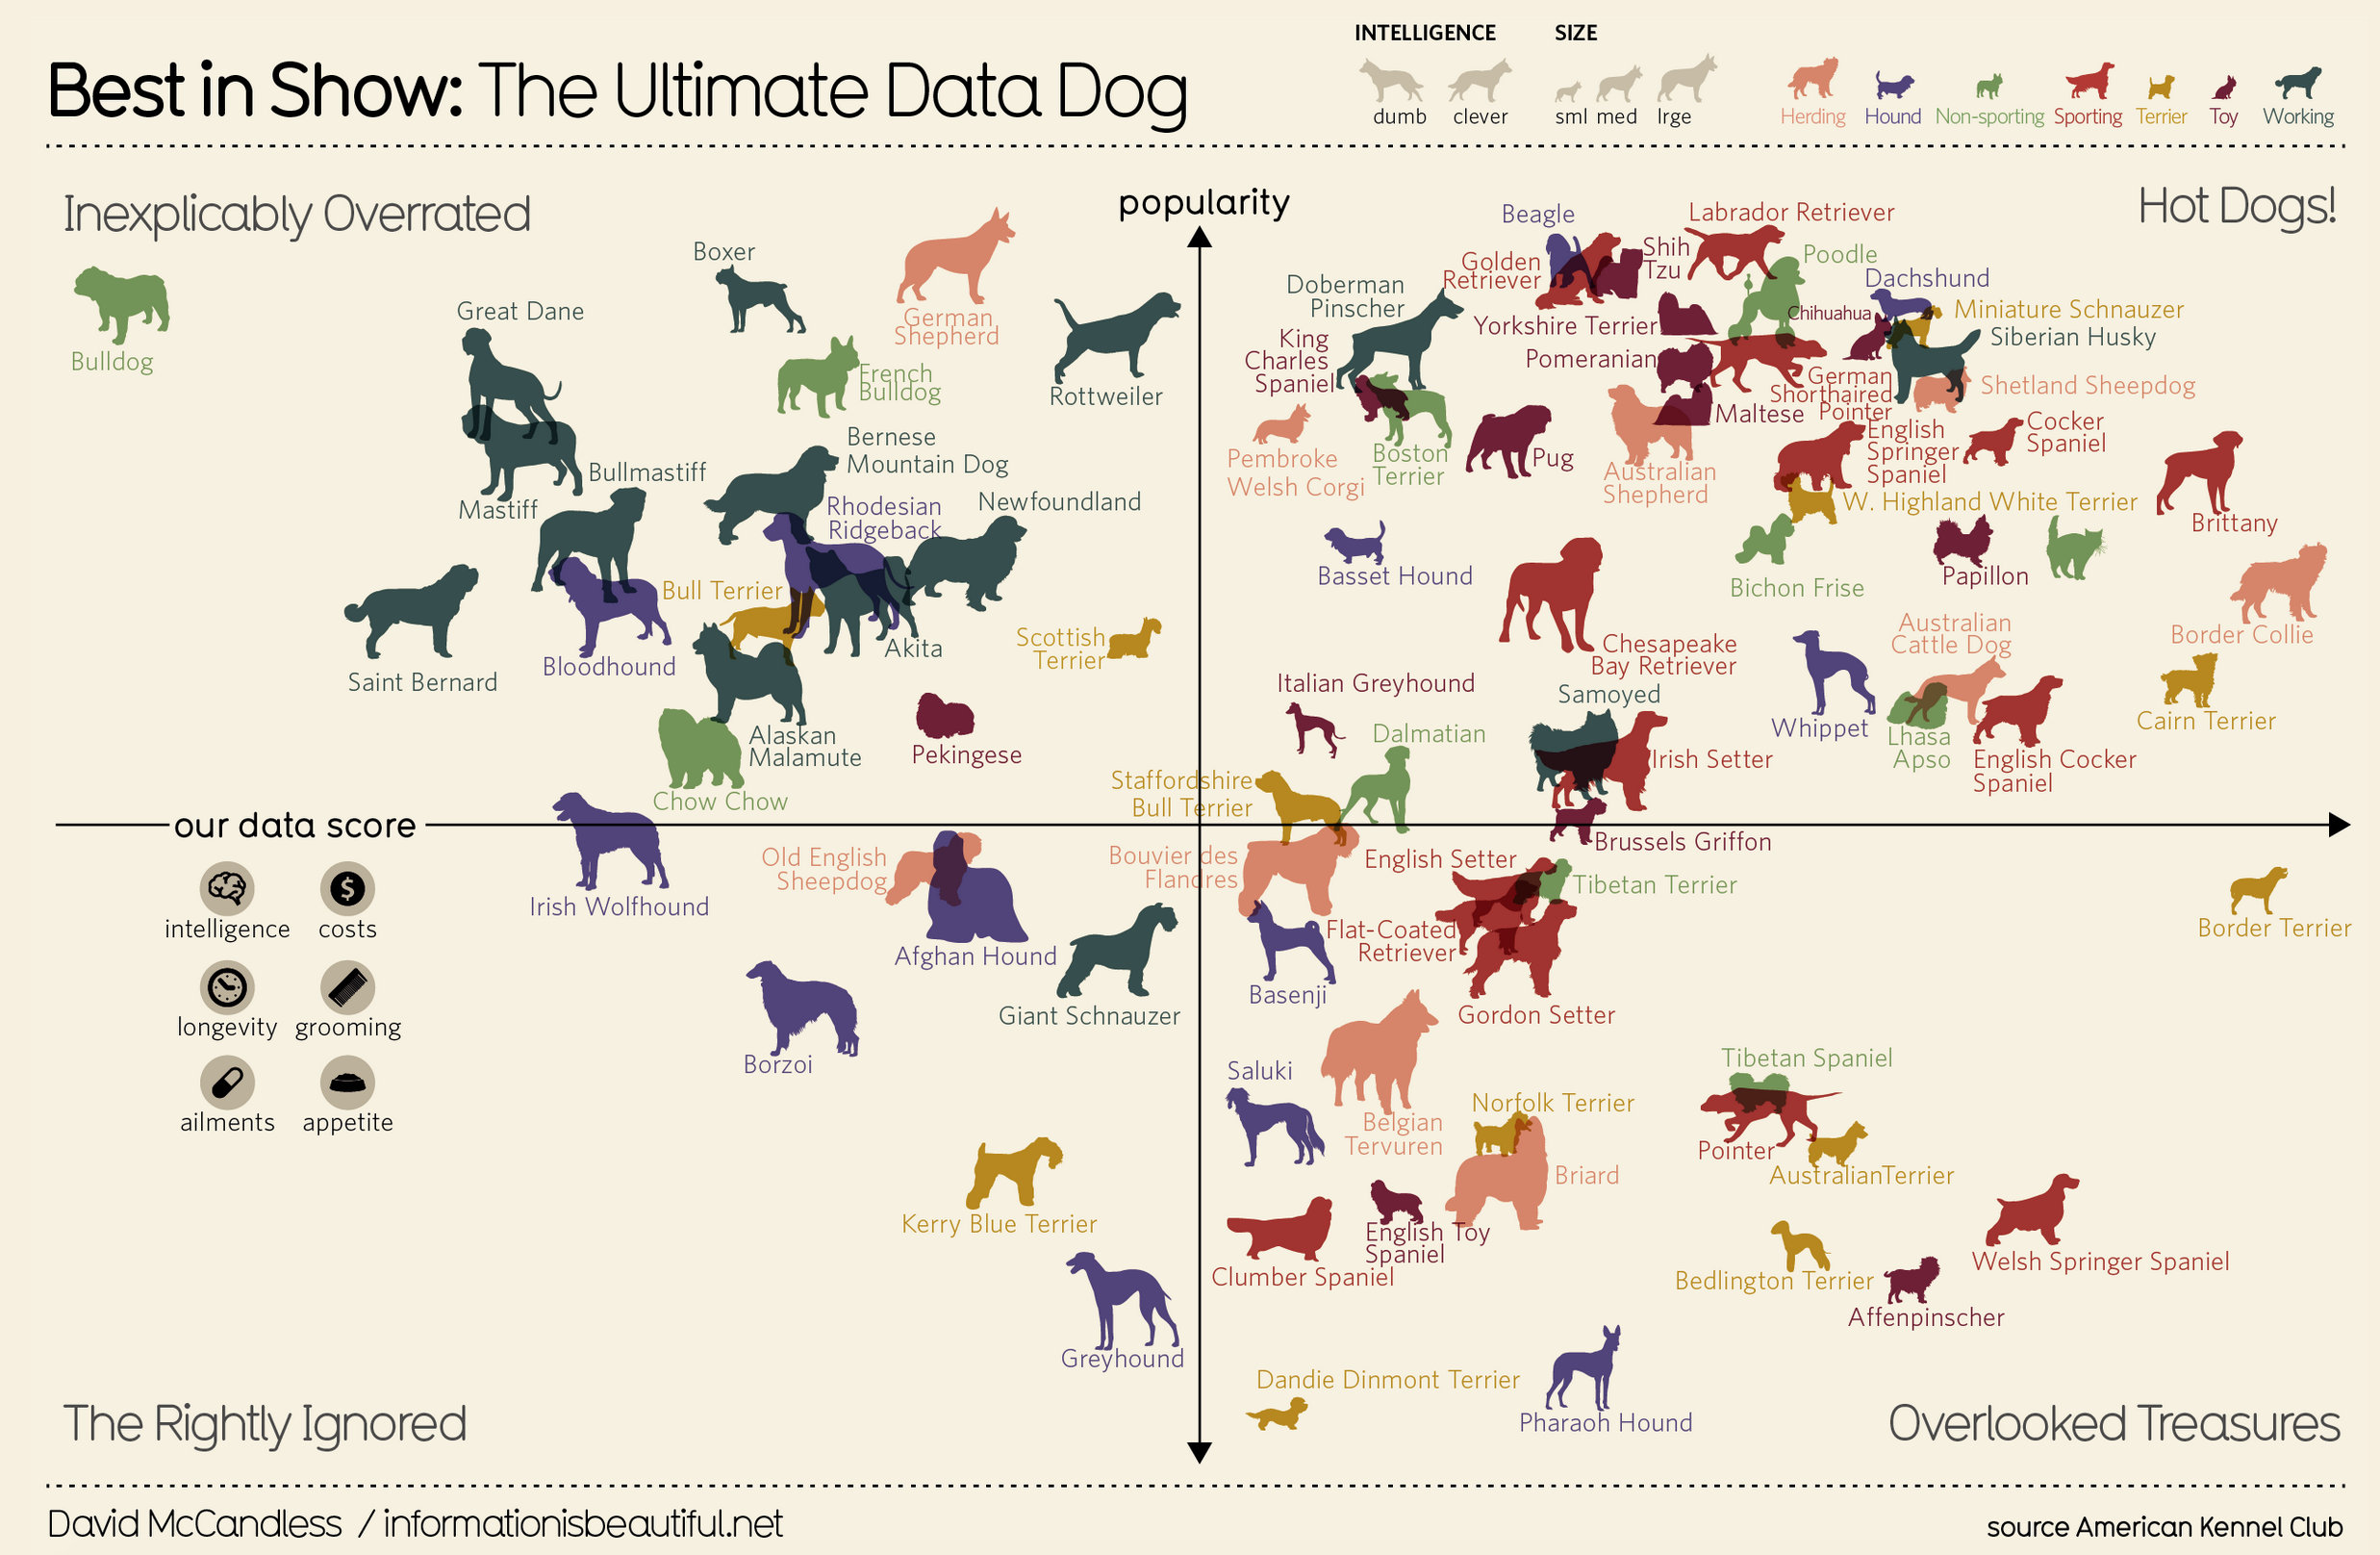
Challenger
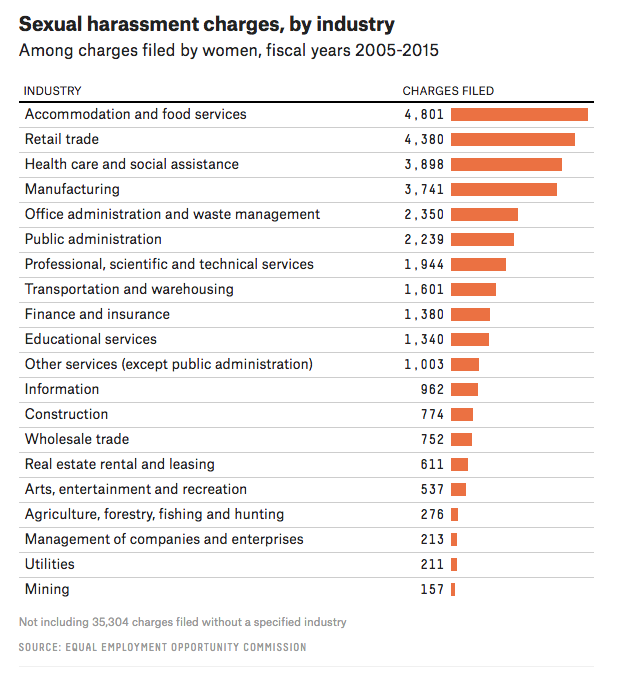
Here’s another one of those charts.
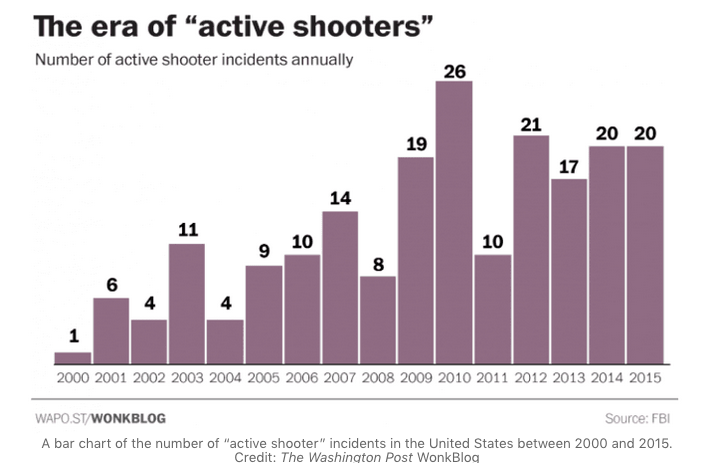
Challenger
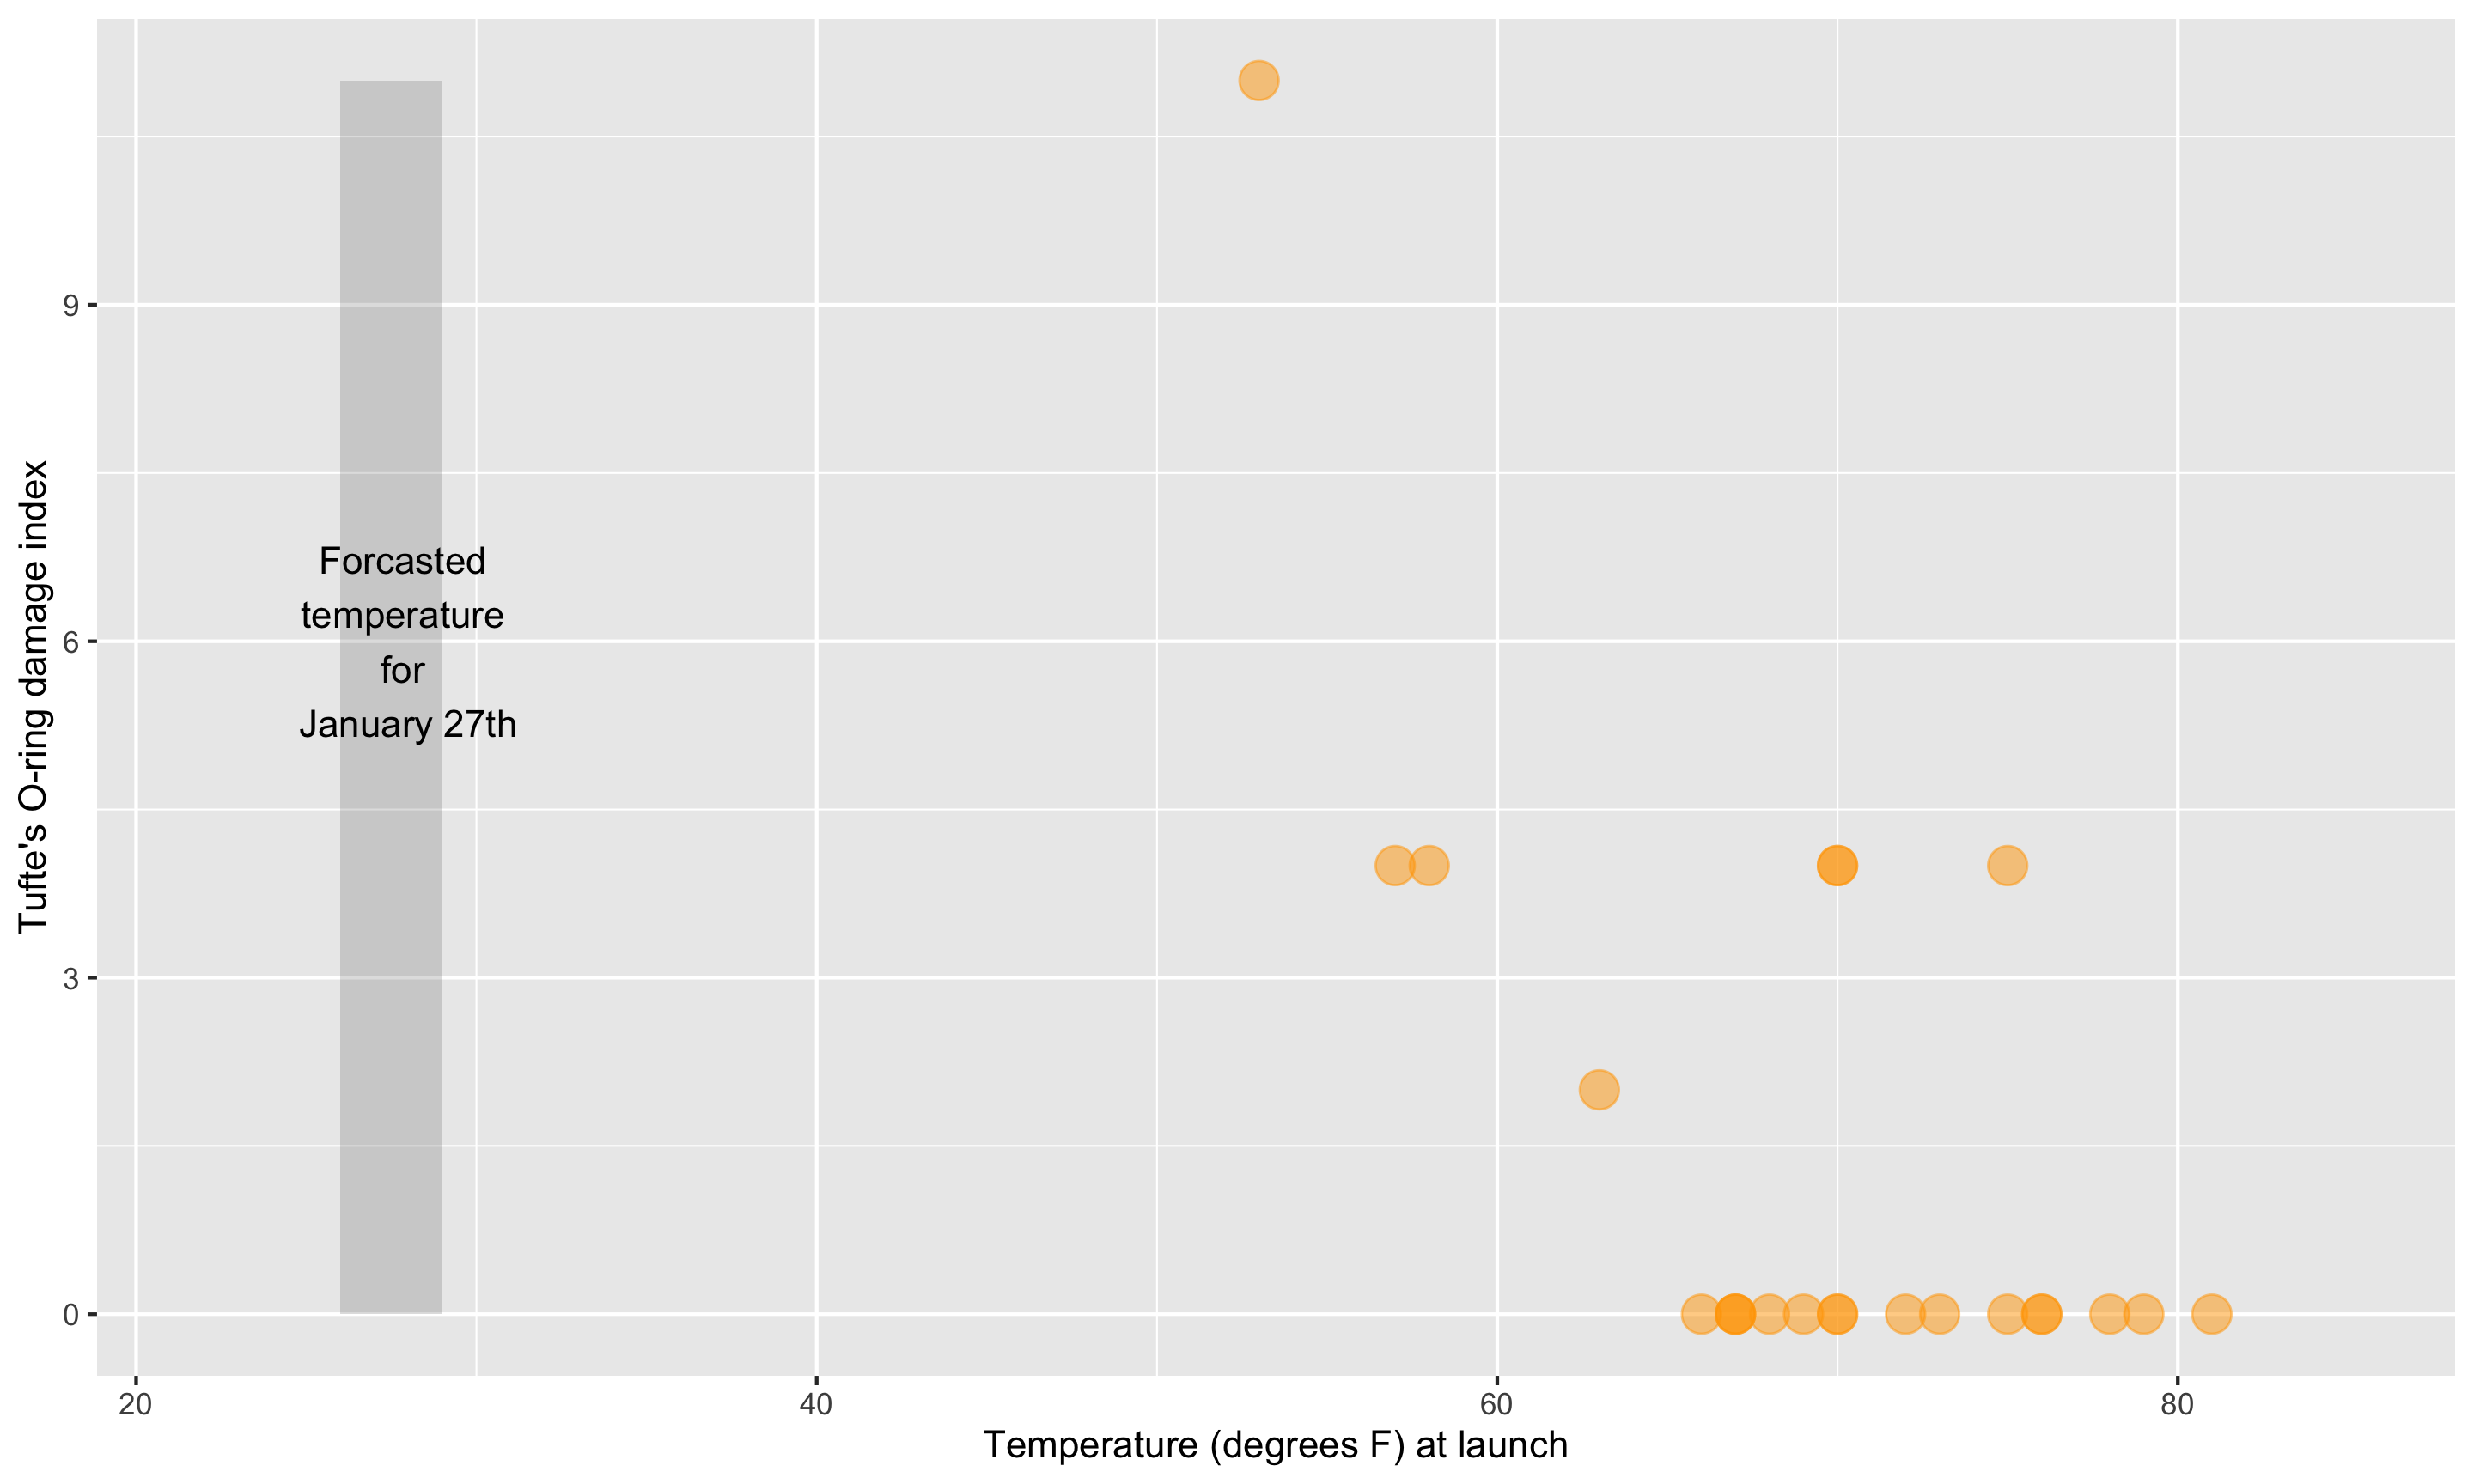
Here’s a graphic created in R from Edward Tufte’s data.
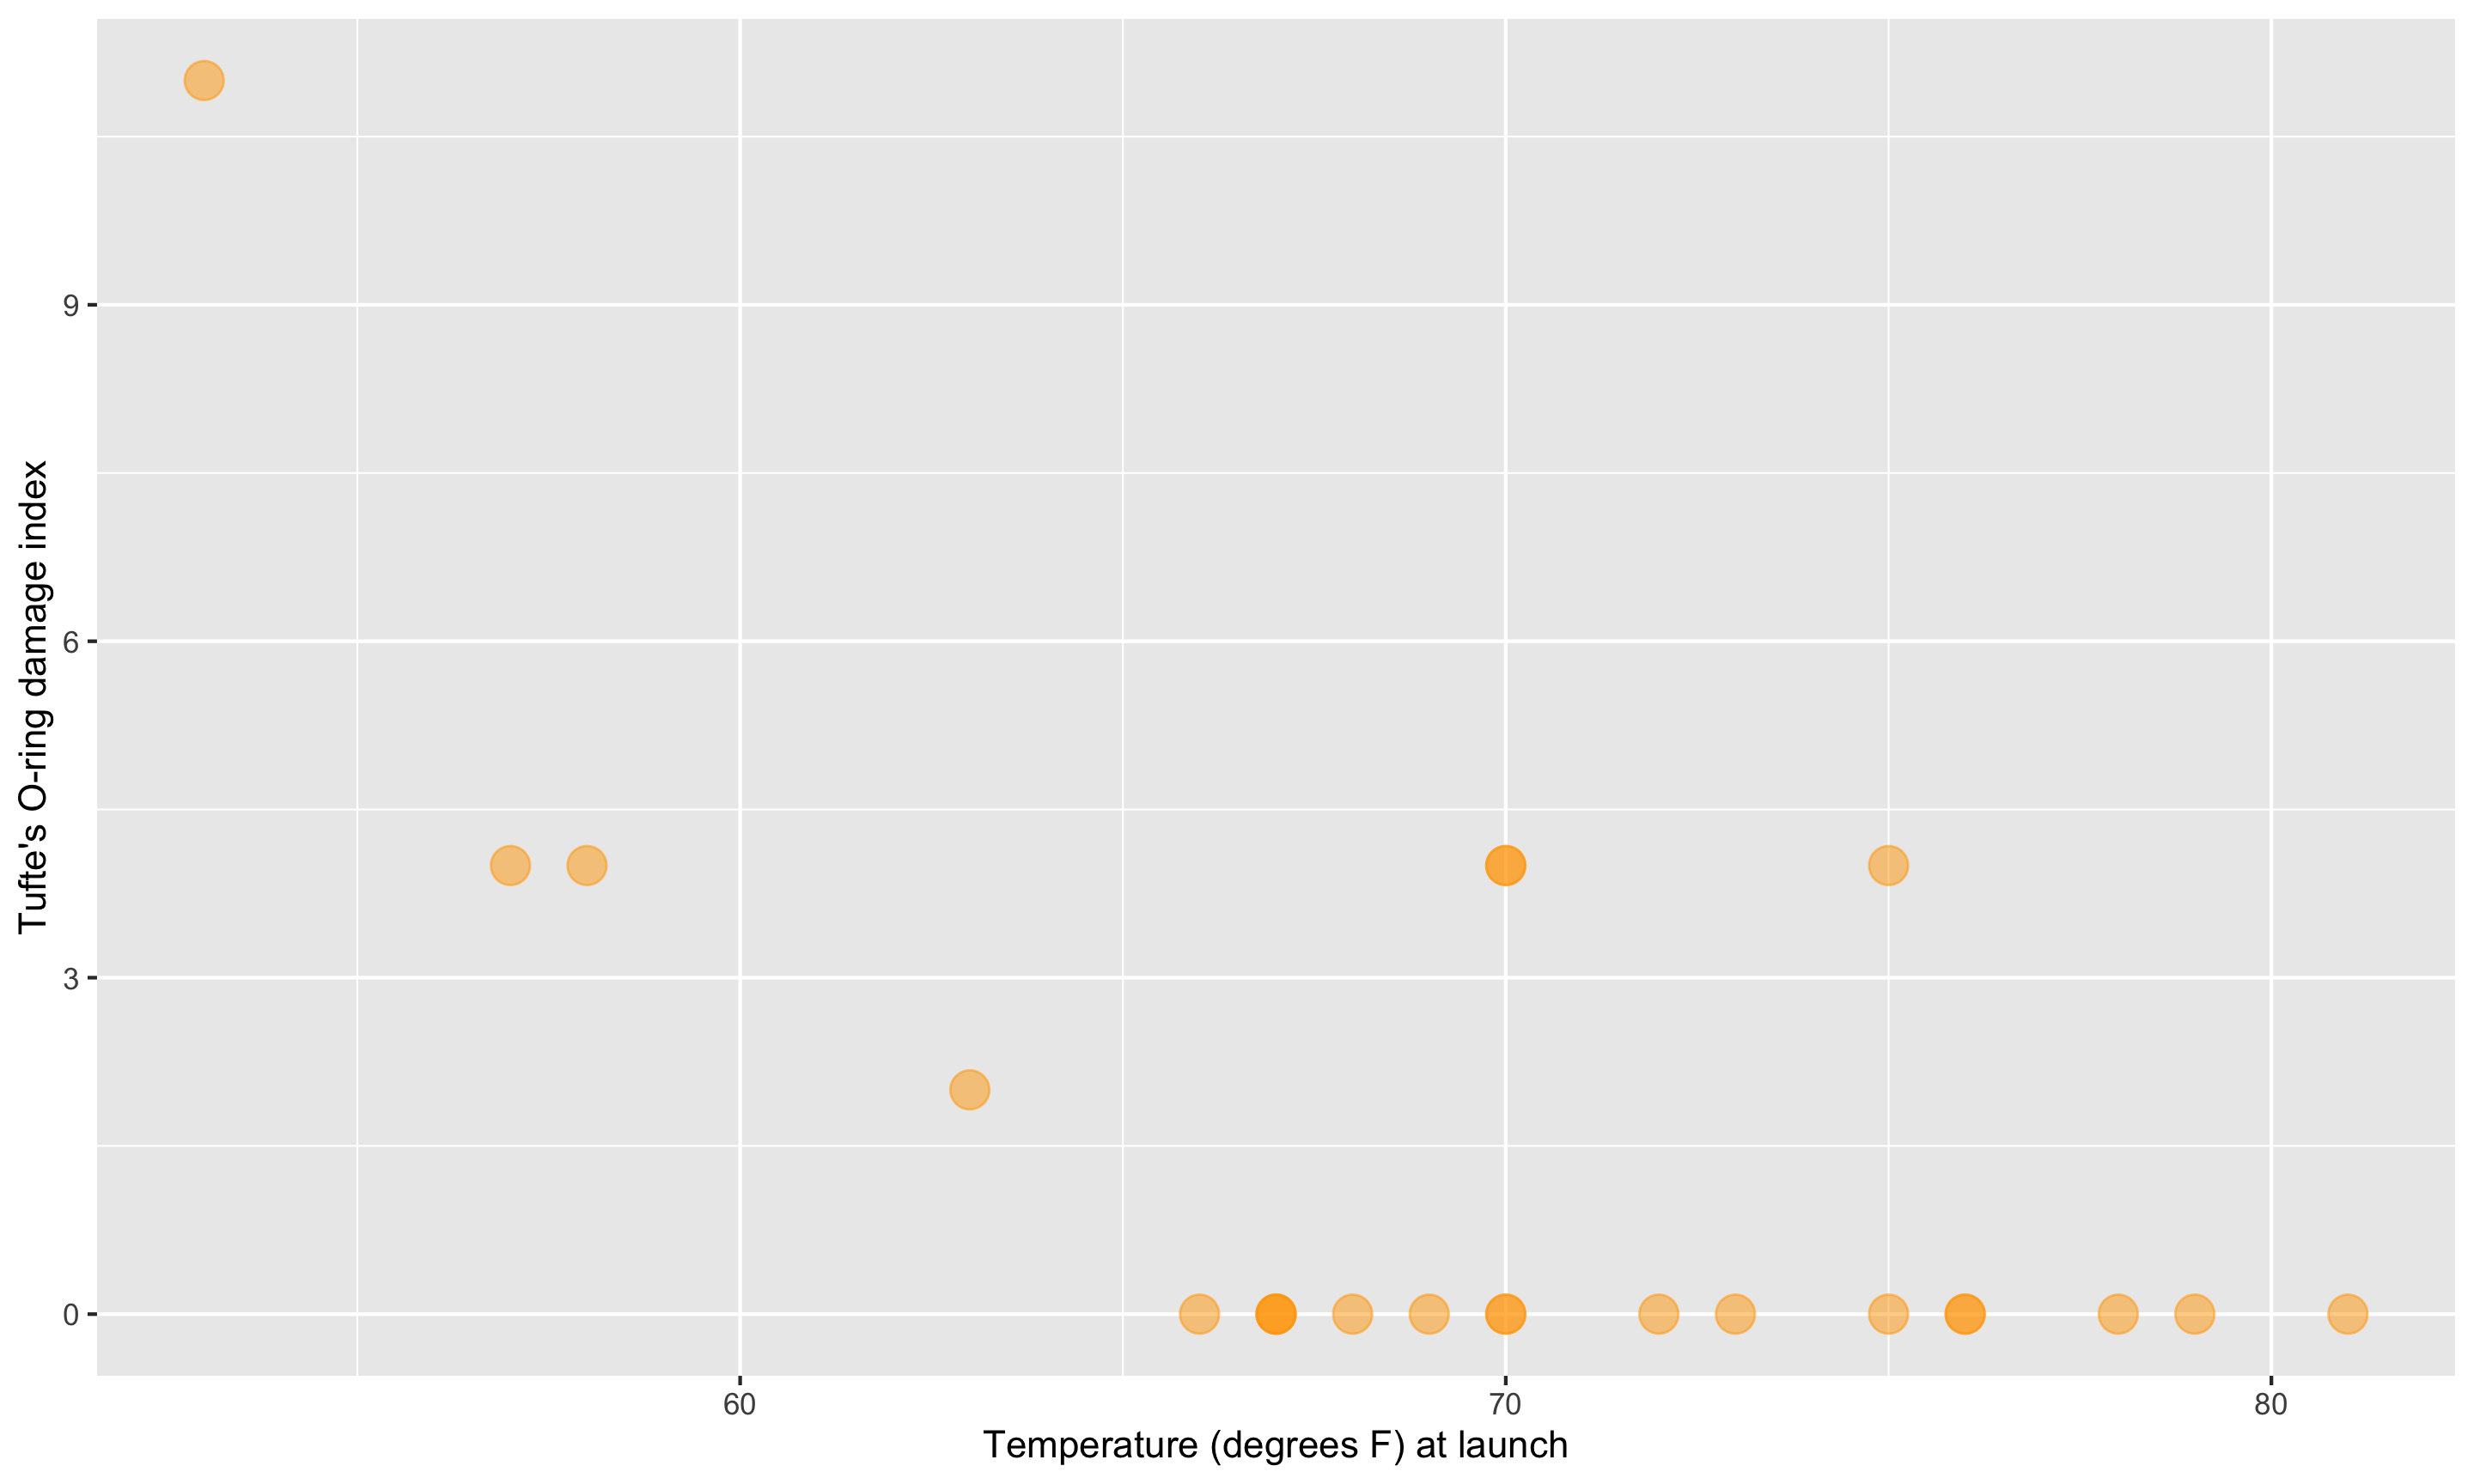
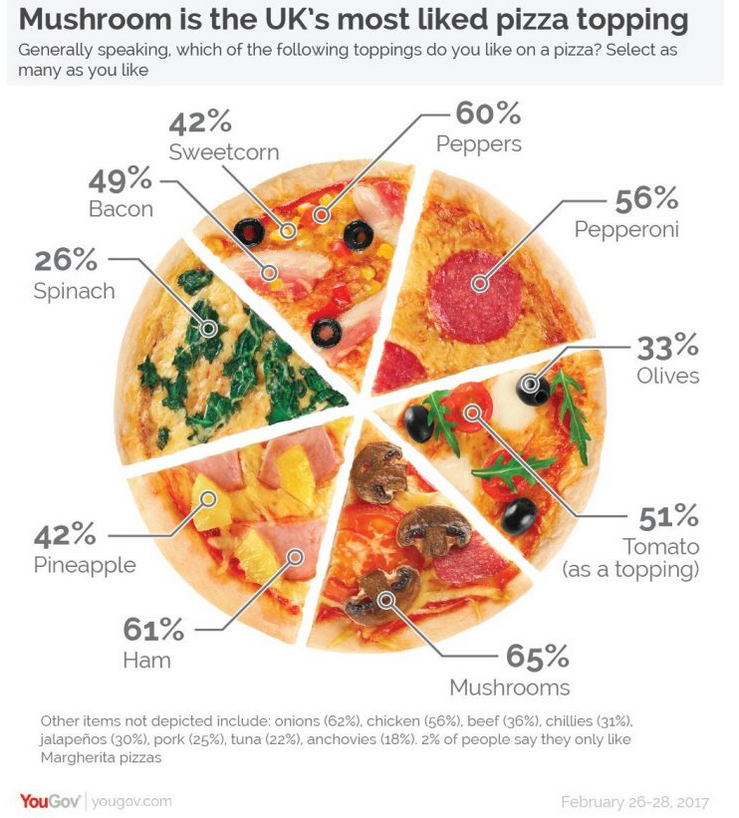
Challenger
This adaptation is a recreation of Edward Tufte’s graphic.
Example 1
- What are the variables?
- What geom are the variables map to?
- What are the aesthetics of the geom?
- How is each variable mapped to an aesthetic?
- What additional context is provided?
- What story is the graph telling?
05:00
Example 2
- What are the variables?
- What geom are the variables map to?
- What are the aesthetics of the geom?
- How is each variable mapped to an aesthetic?
- What additional context is provided?
- What story is the graph telling?
05:00
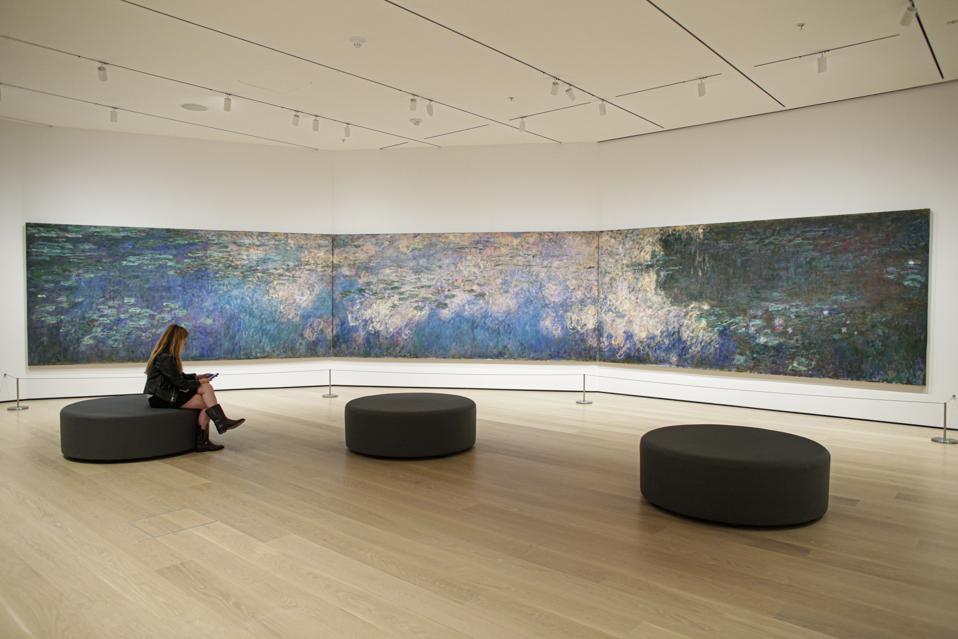
Context Example
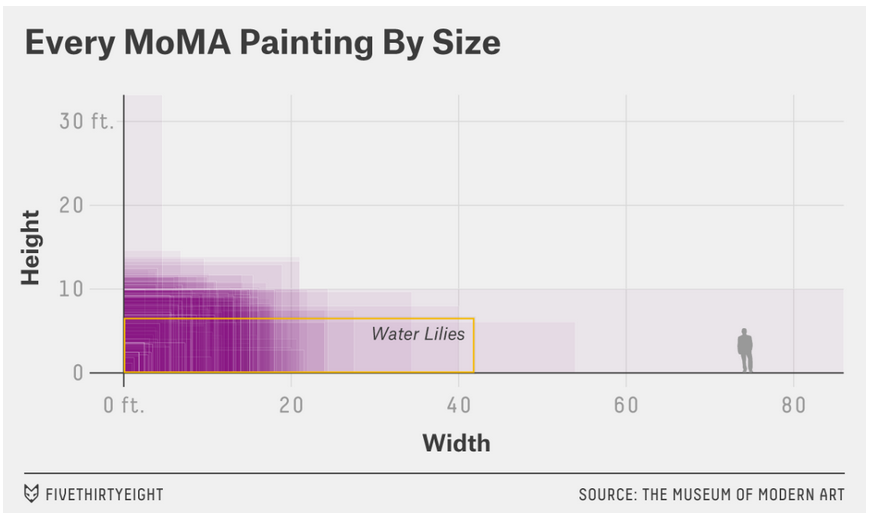
Water Lilies
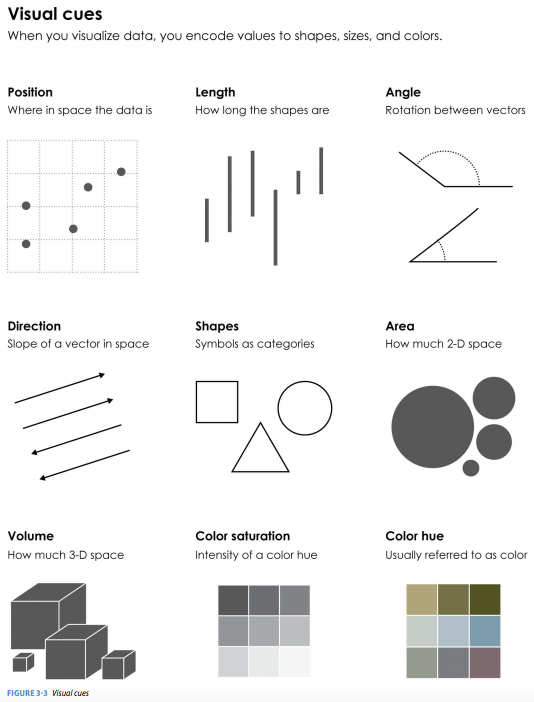
What visual cues are easier to compare?
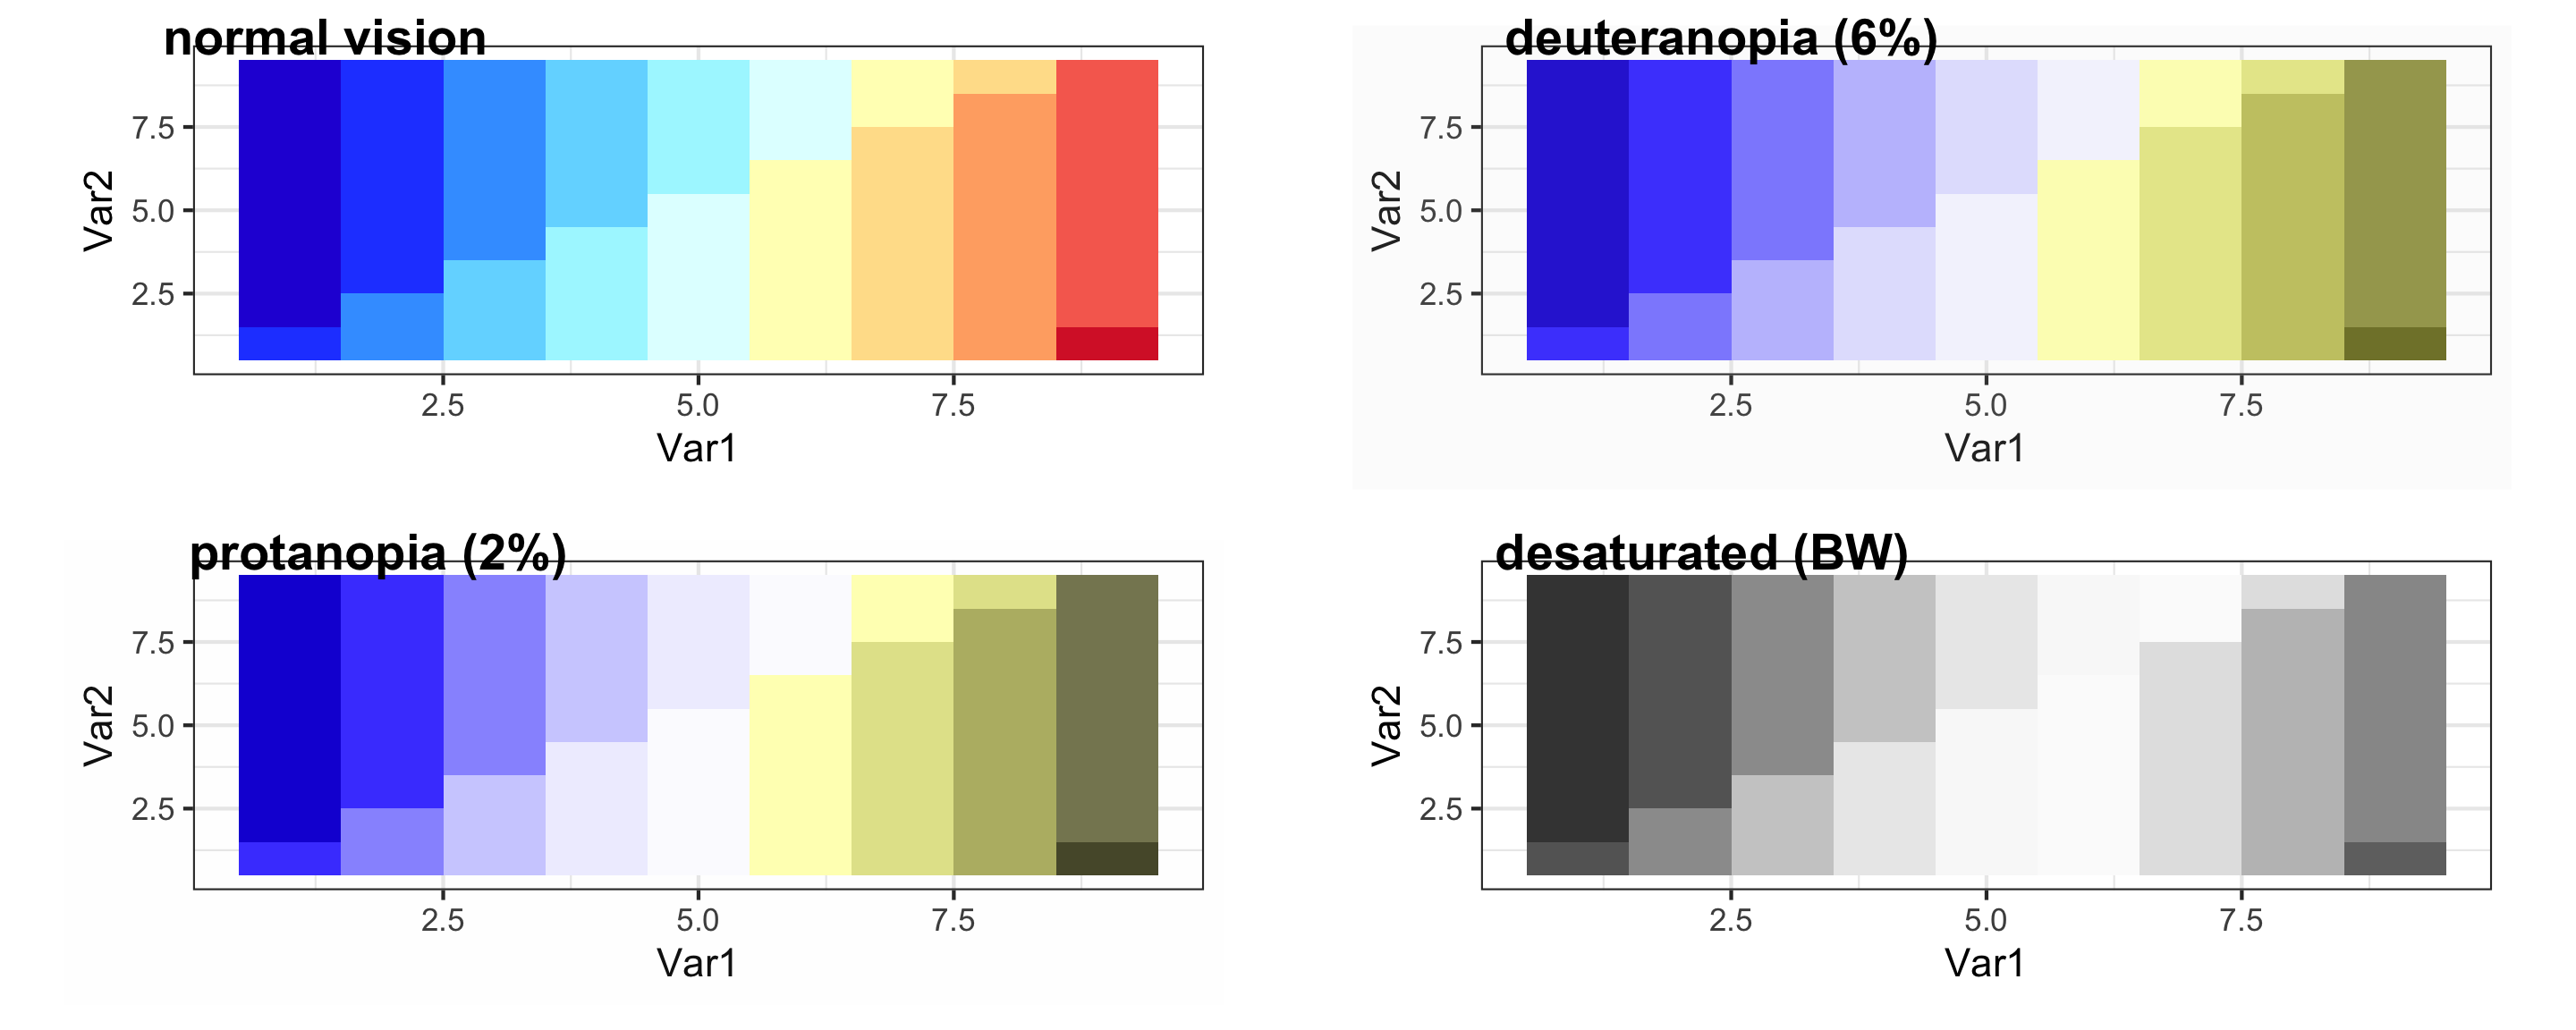
What to consider with color?
Consider color blindness.
Color Palettes – Sequential
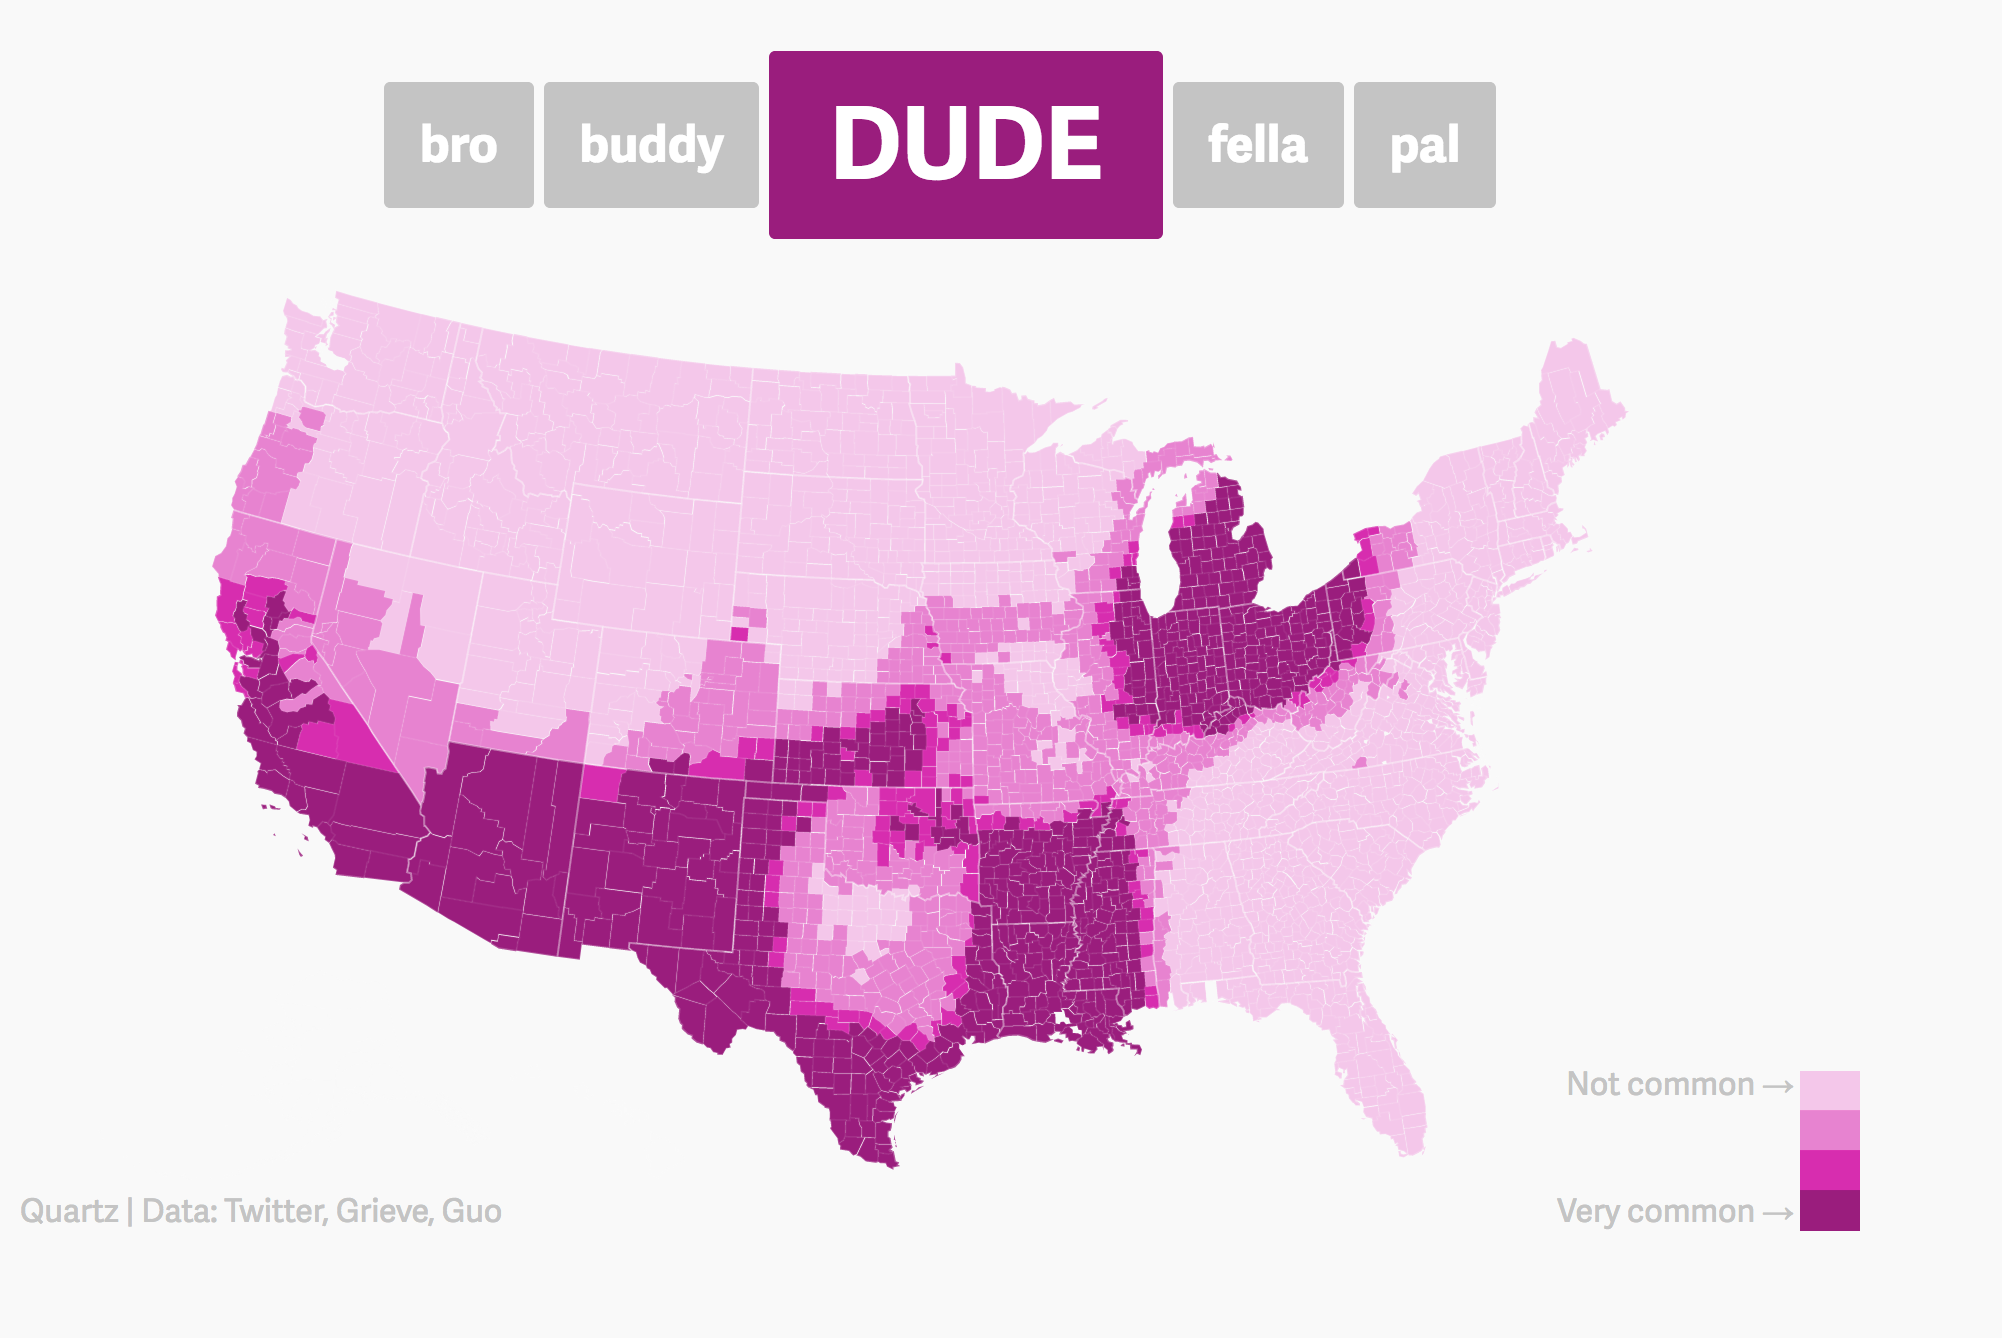
Maps, like the Dude map are also a great way to provide context!
Color Palettes – Diverging
Color Palettes – Qualitative
Many Ways To Visually Tell A Story
Washington Post’s Approach:
Bad Graphics
Because of all the design choices, it is much easier to make a bad graph than a good graph.
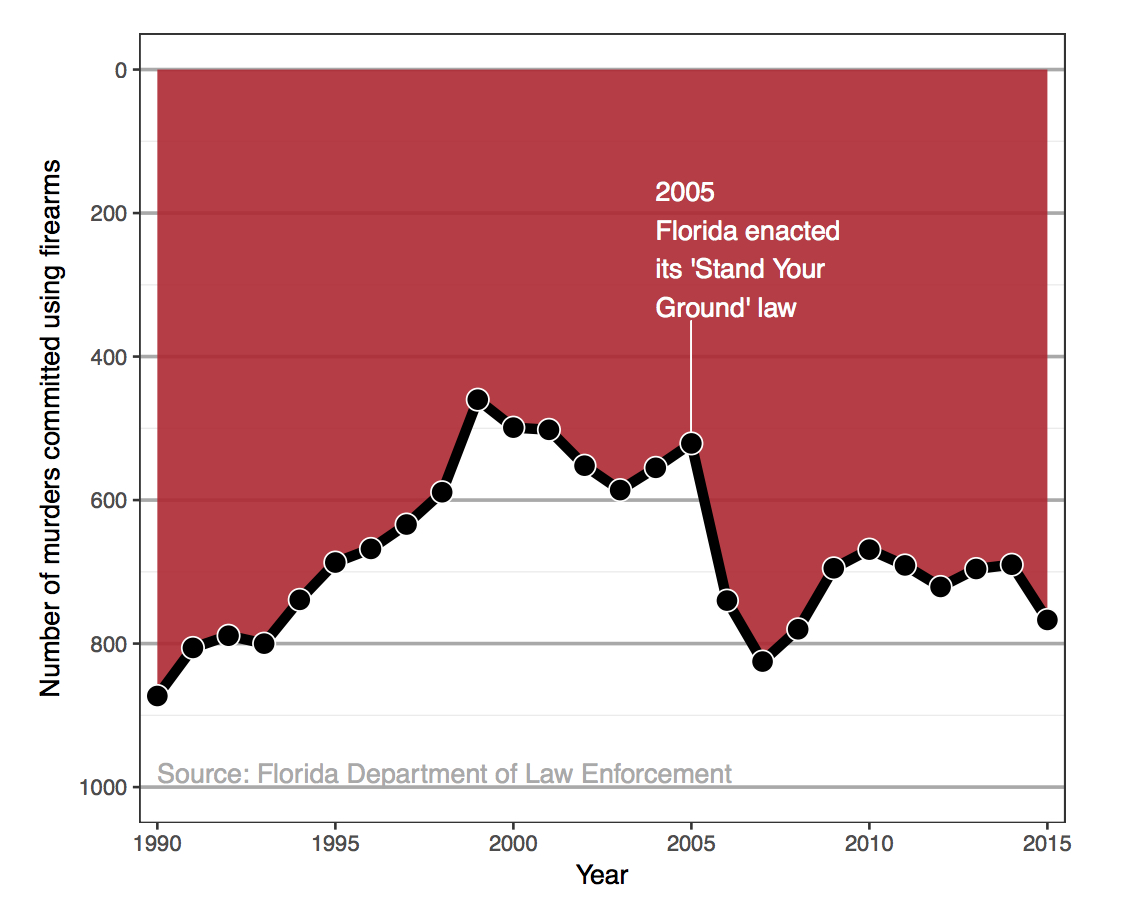
Misleading Graphics
Be careful that your design choices don’t cause your viewer to draw incorrect conclusions about the data:
- Just letting the software make all the design choices can still lead to misleading graphs (recall the Georgia COVID graph).