
Statistical Thinking
Grayson White
Math 141
Week 1 | Fall 2025
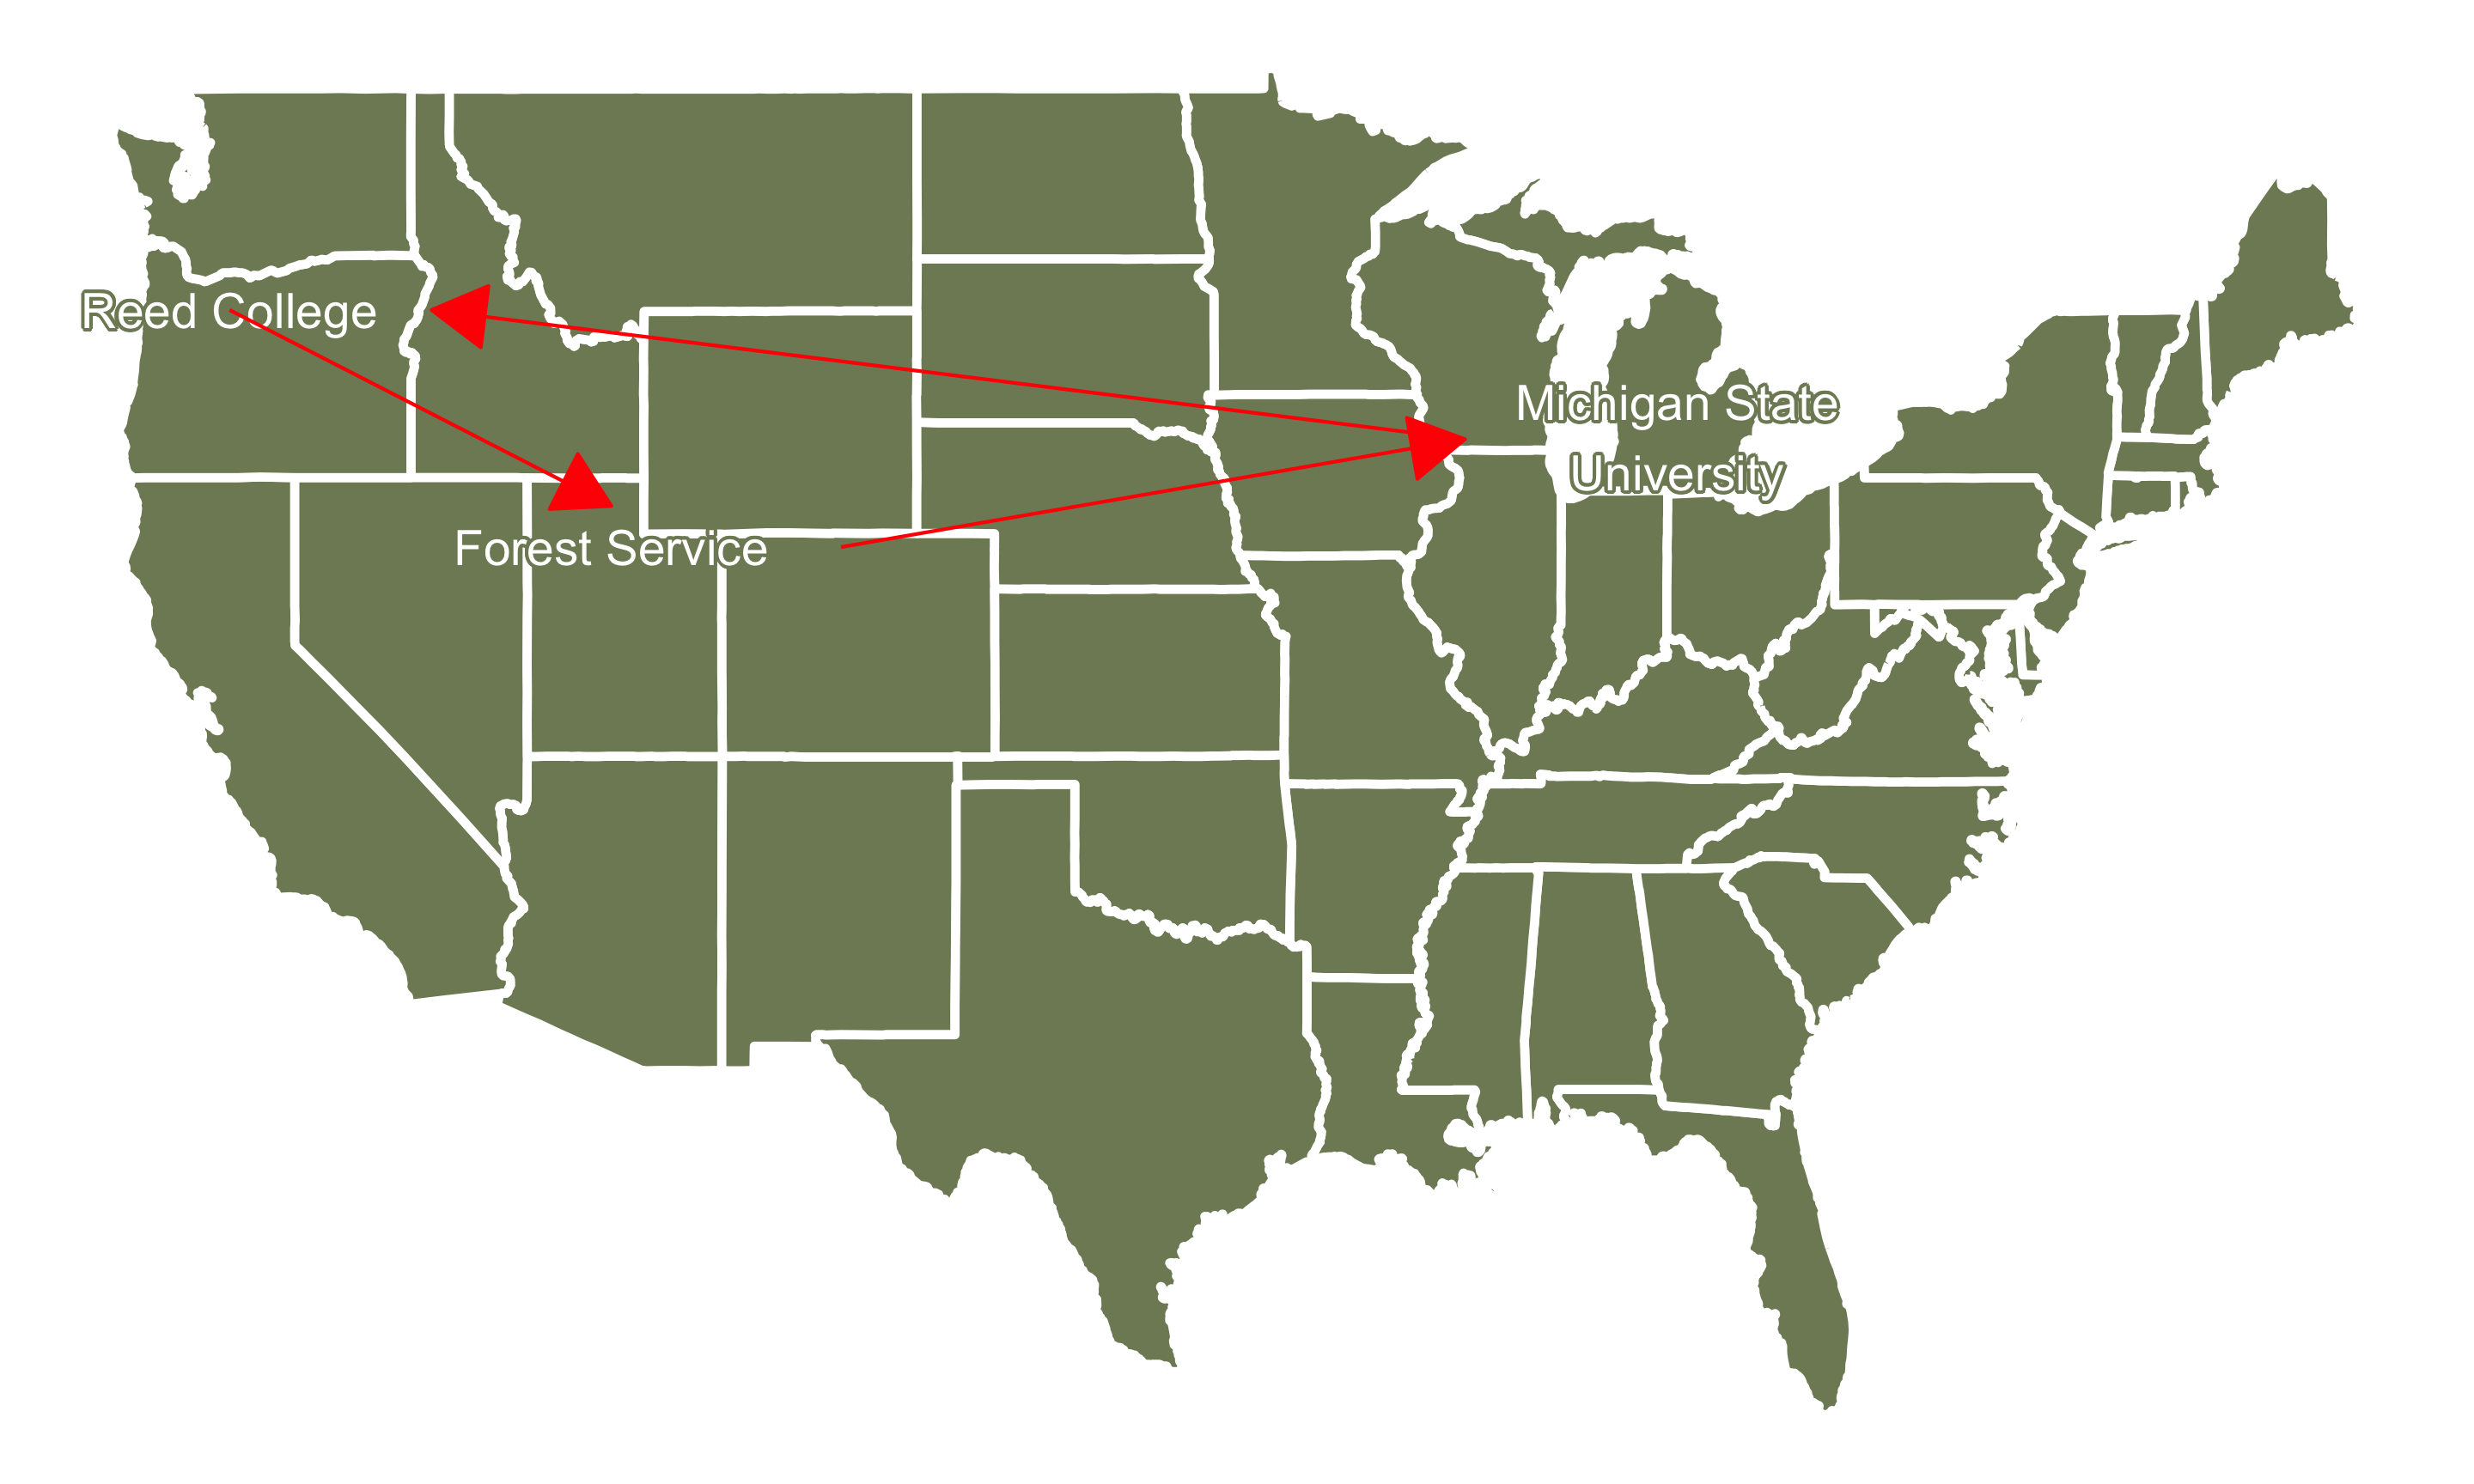
Research Interests
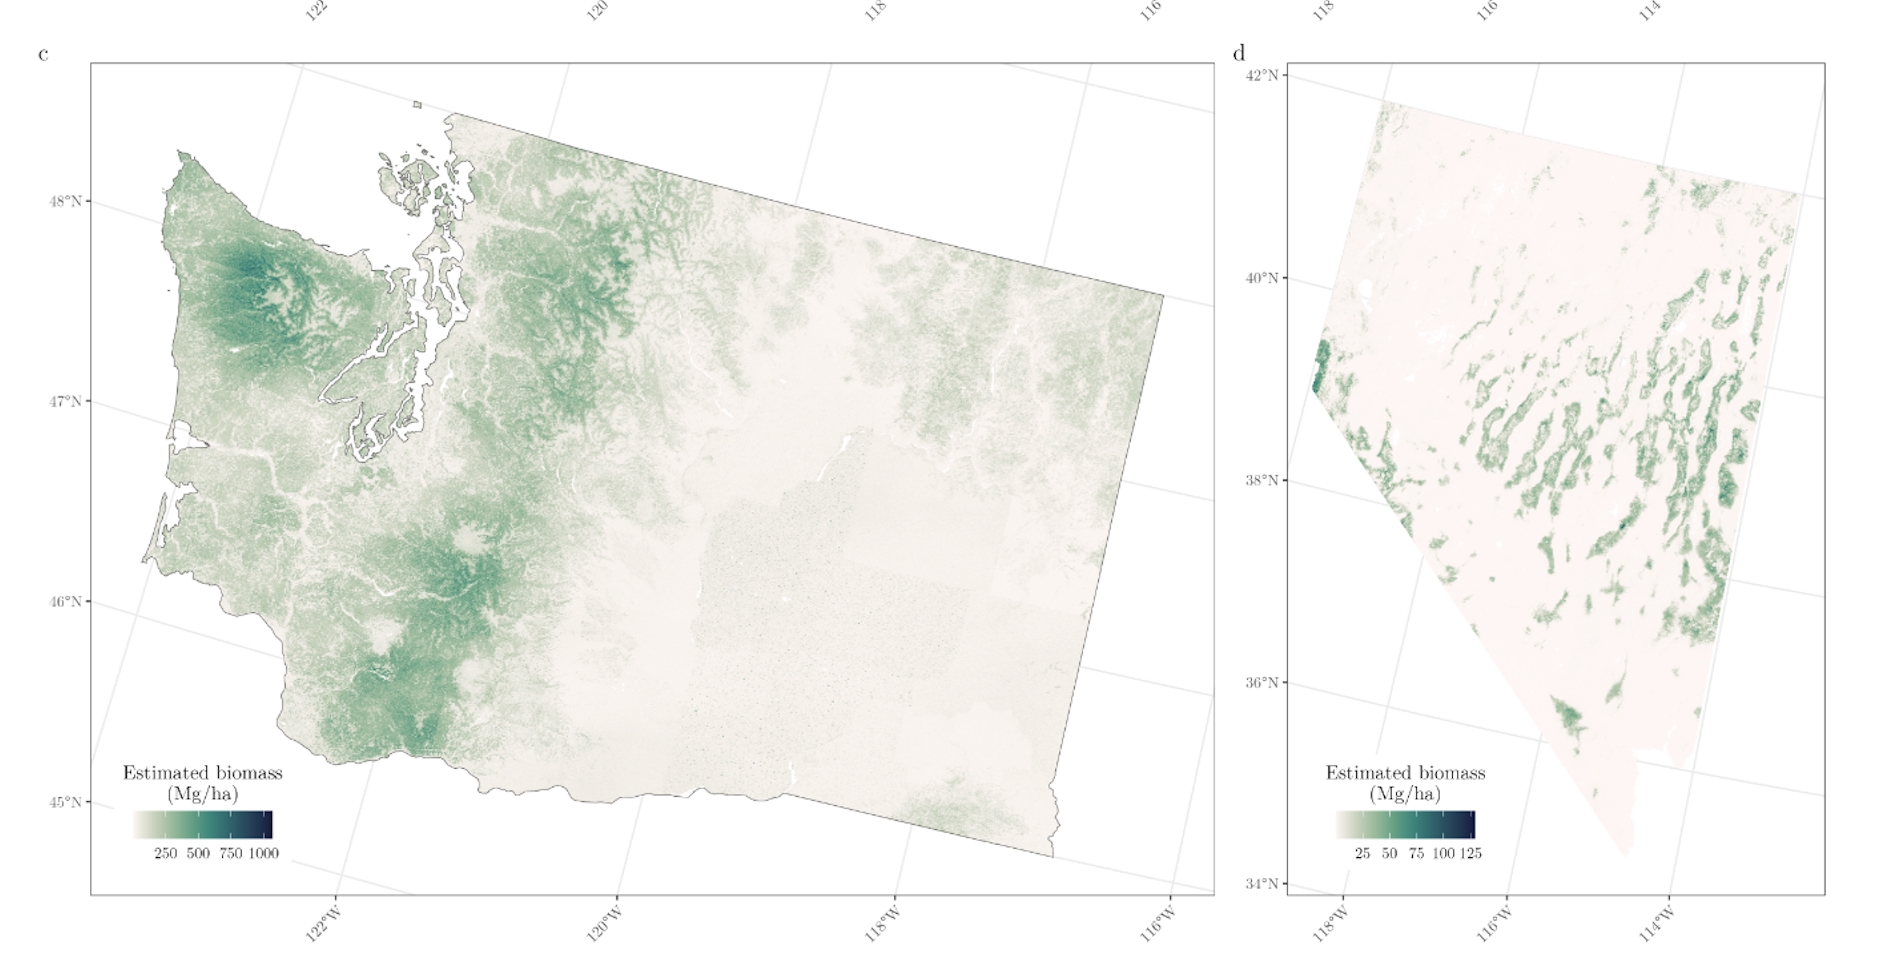
Statistical modeling with environmental applications
Research Interests
Advising Undergraduate Forestry Data Science Research

Getting Started in Math 141
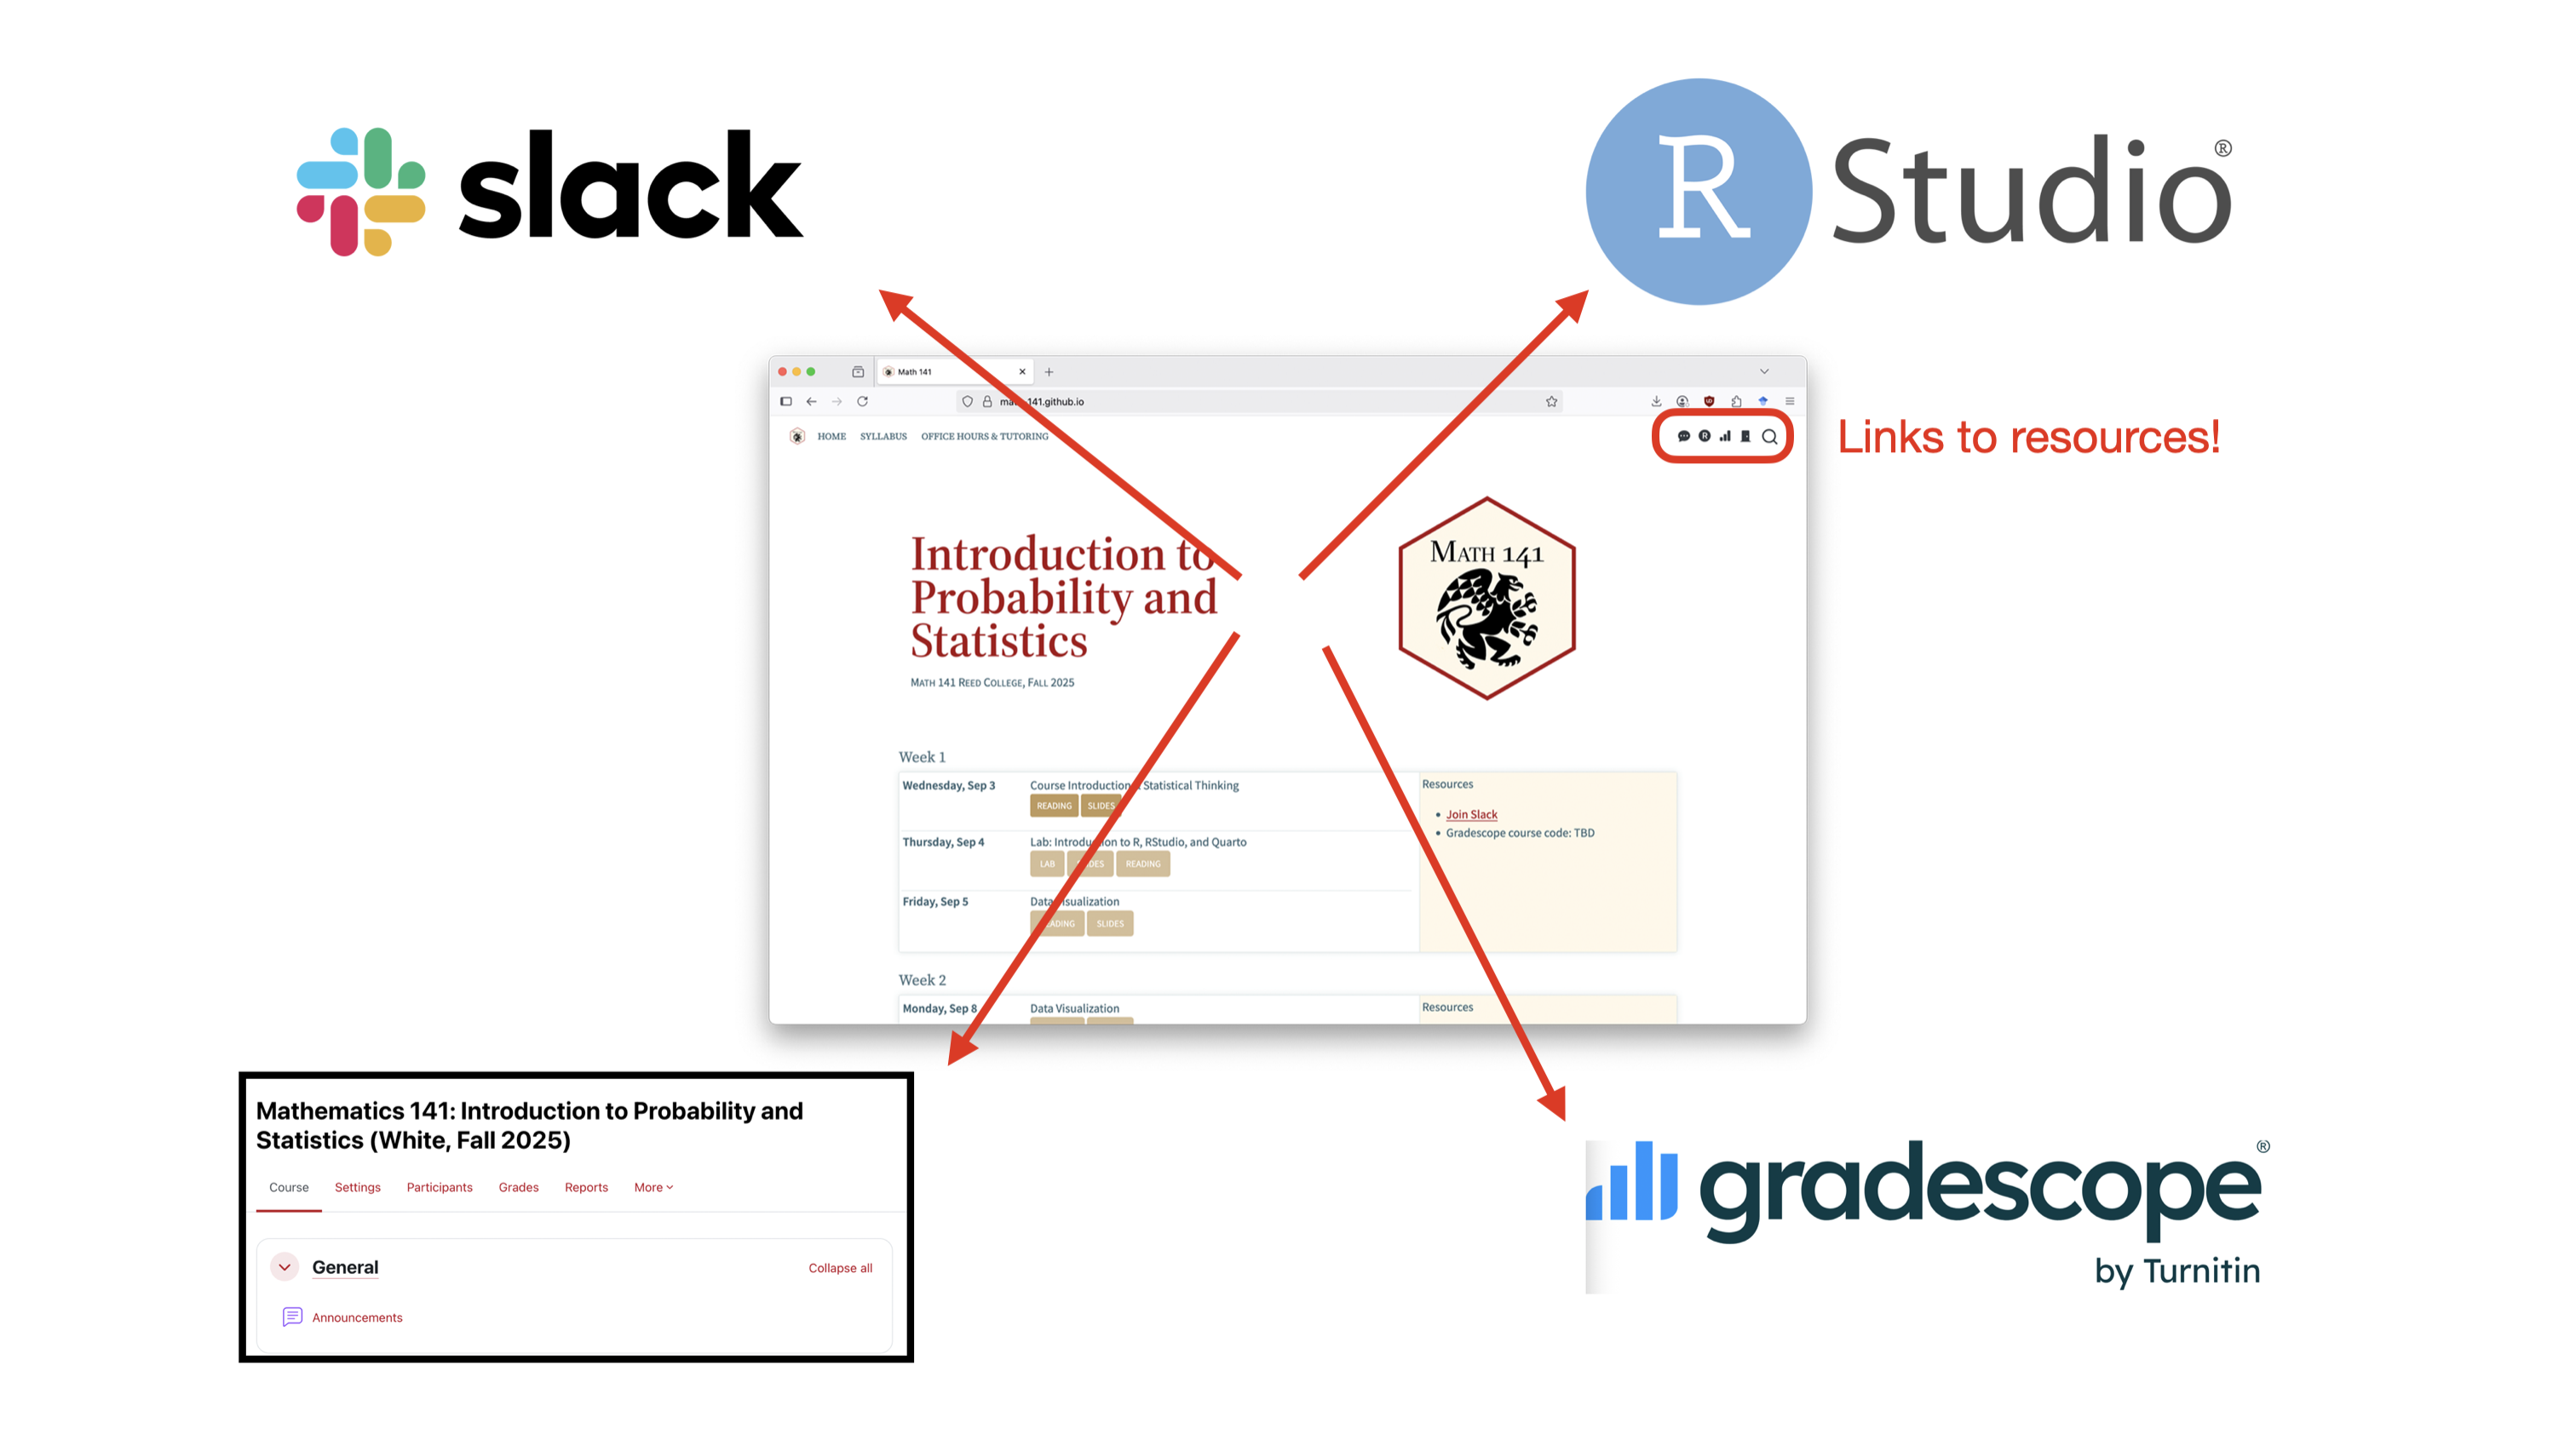
Course website
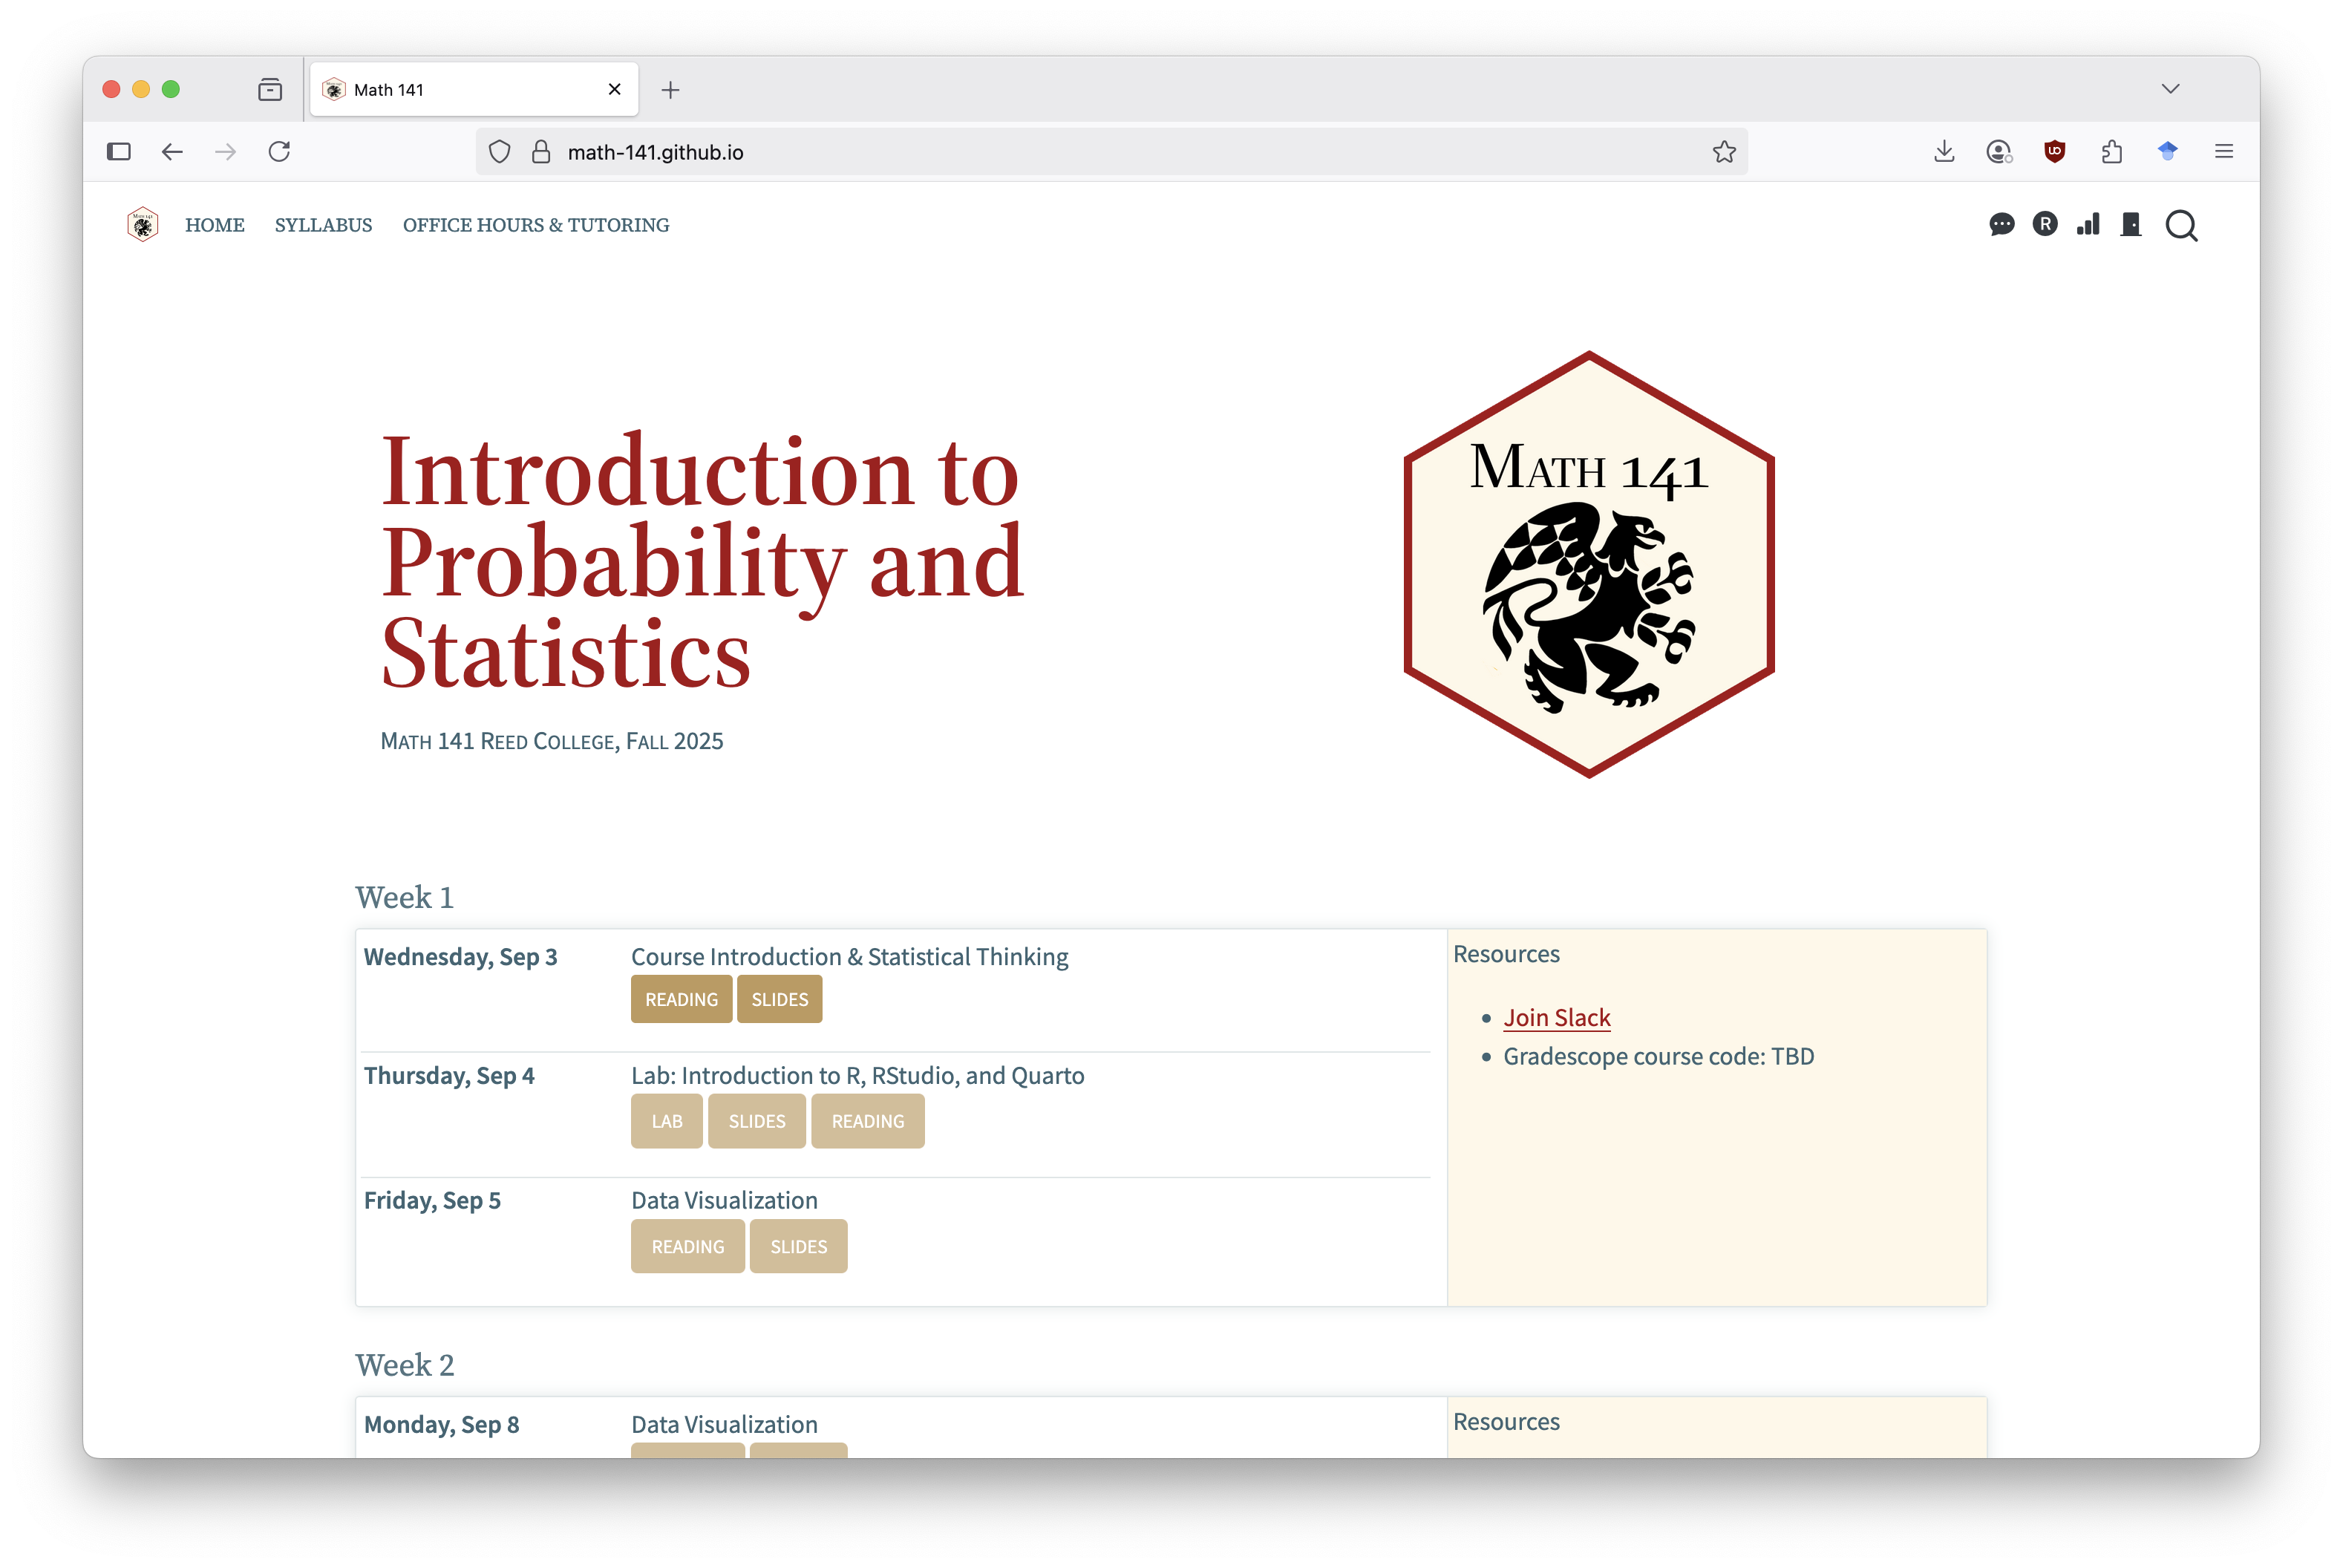
The course website, math-141.github.io, will be the central location for all our course materials.
We’ll use a few other resources to navigate Math 141, but all other tools can be accessed by the quick links in the course website!
Getting Started in Math 141: Finding Resources
Getting Started in Math 141: Finding Resources
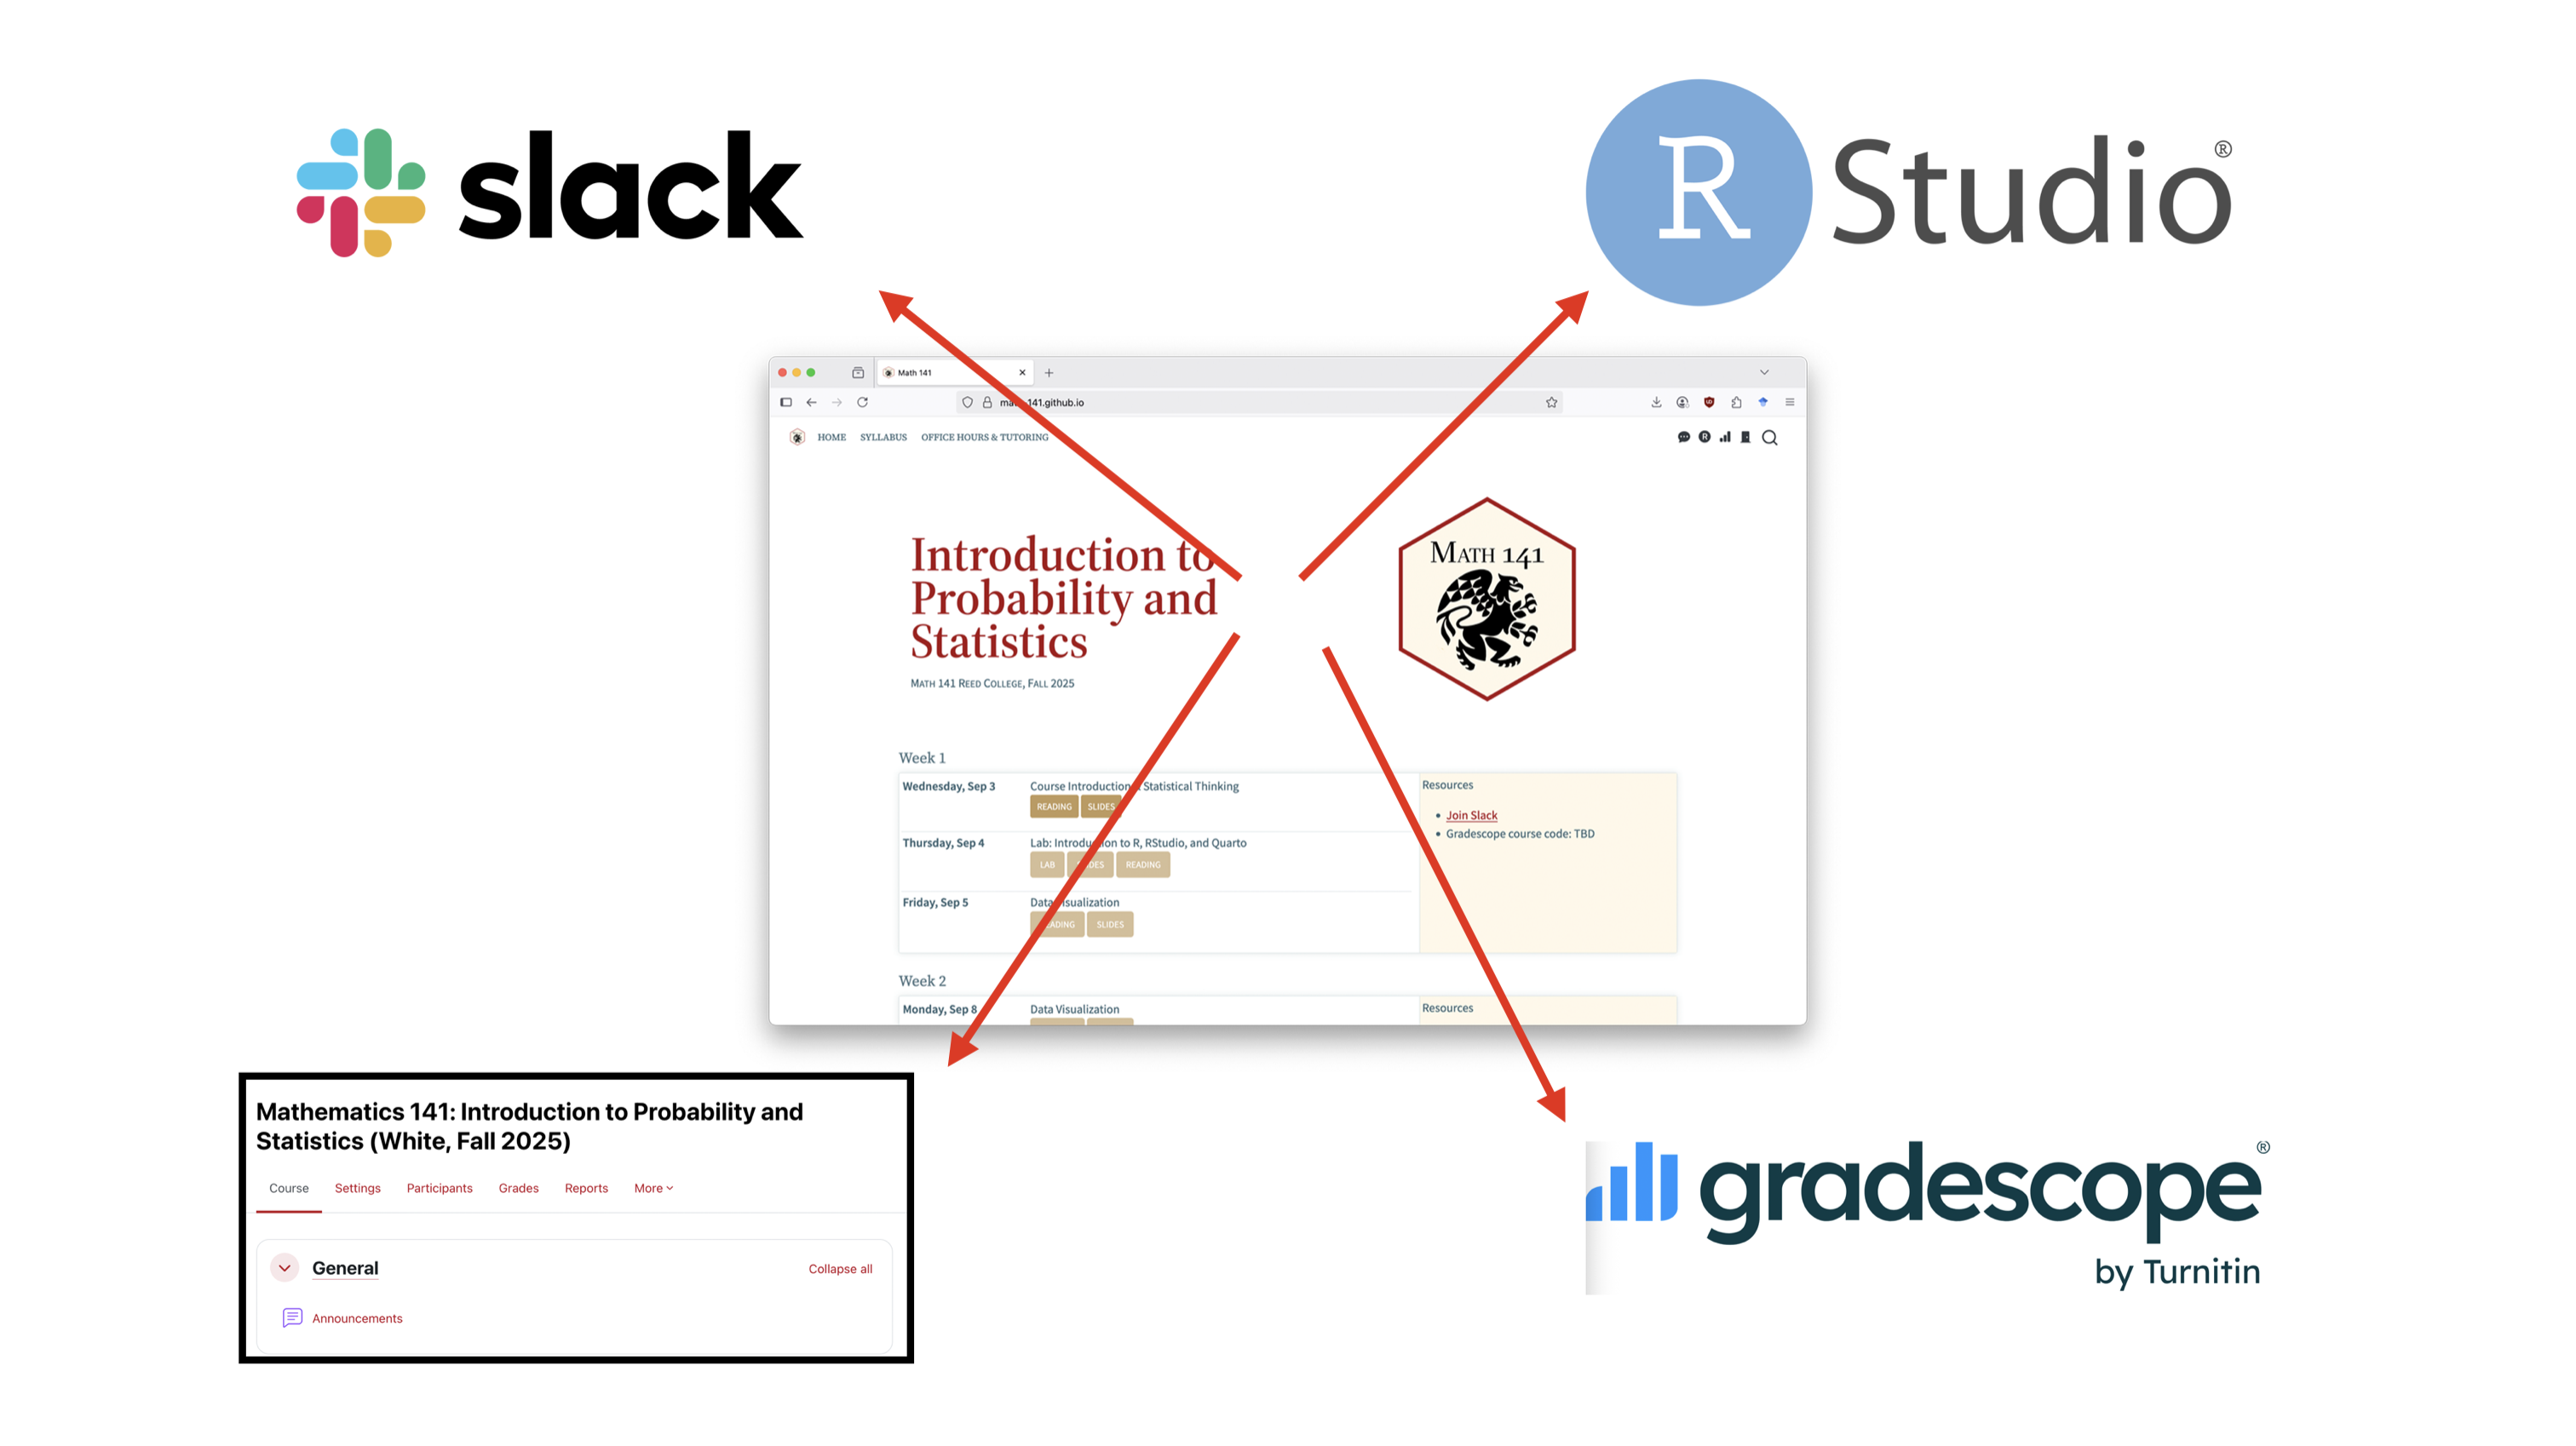
Getting Started in Math 141: Finding Resources
Math 141: The whole game
Course expectations and structure

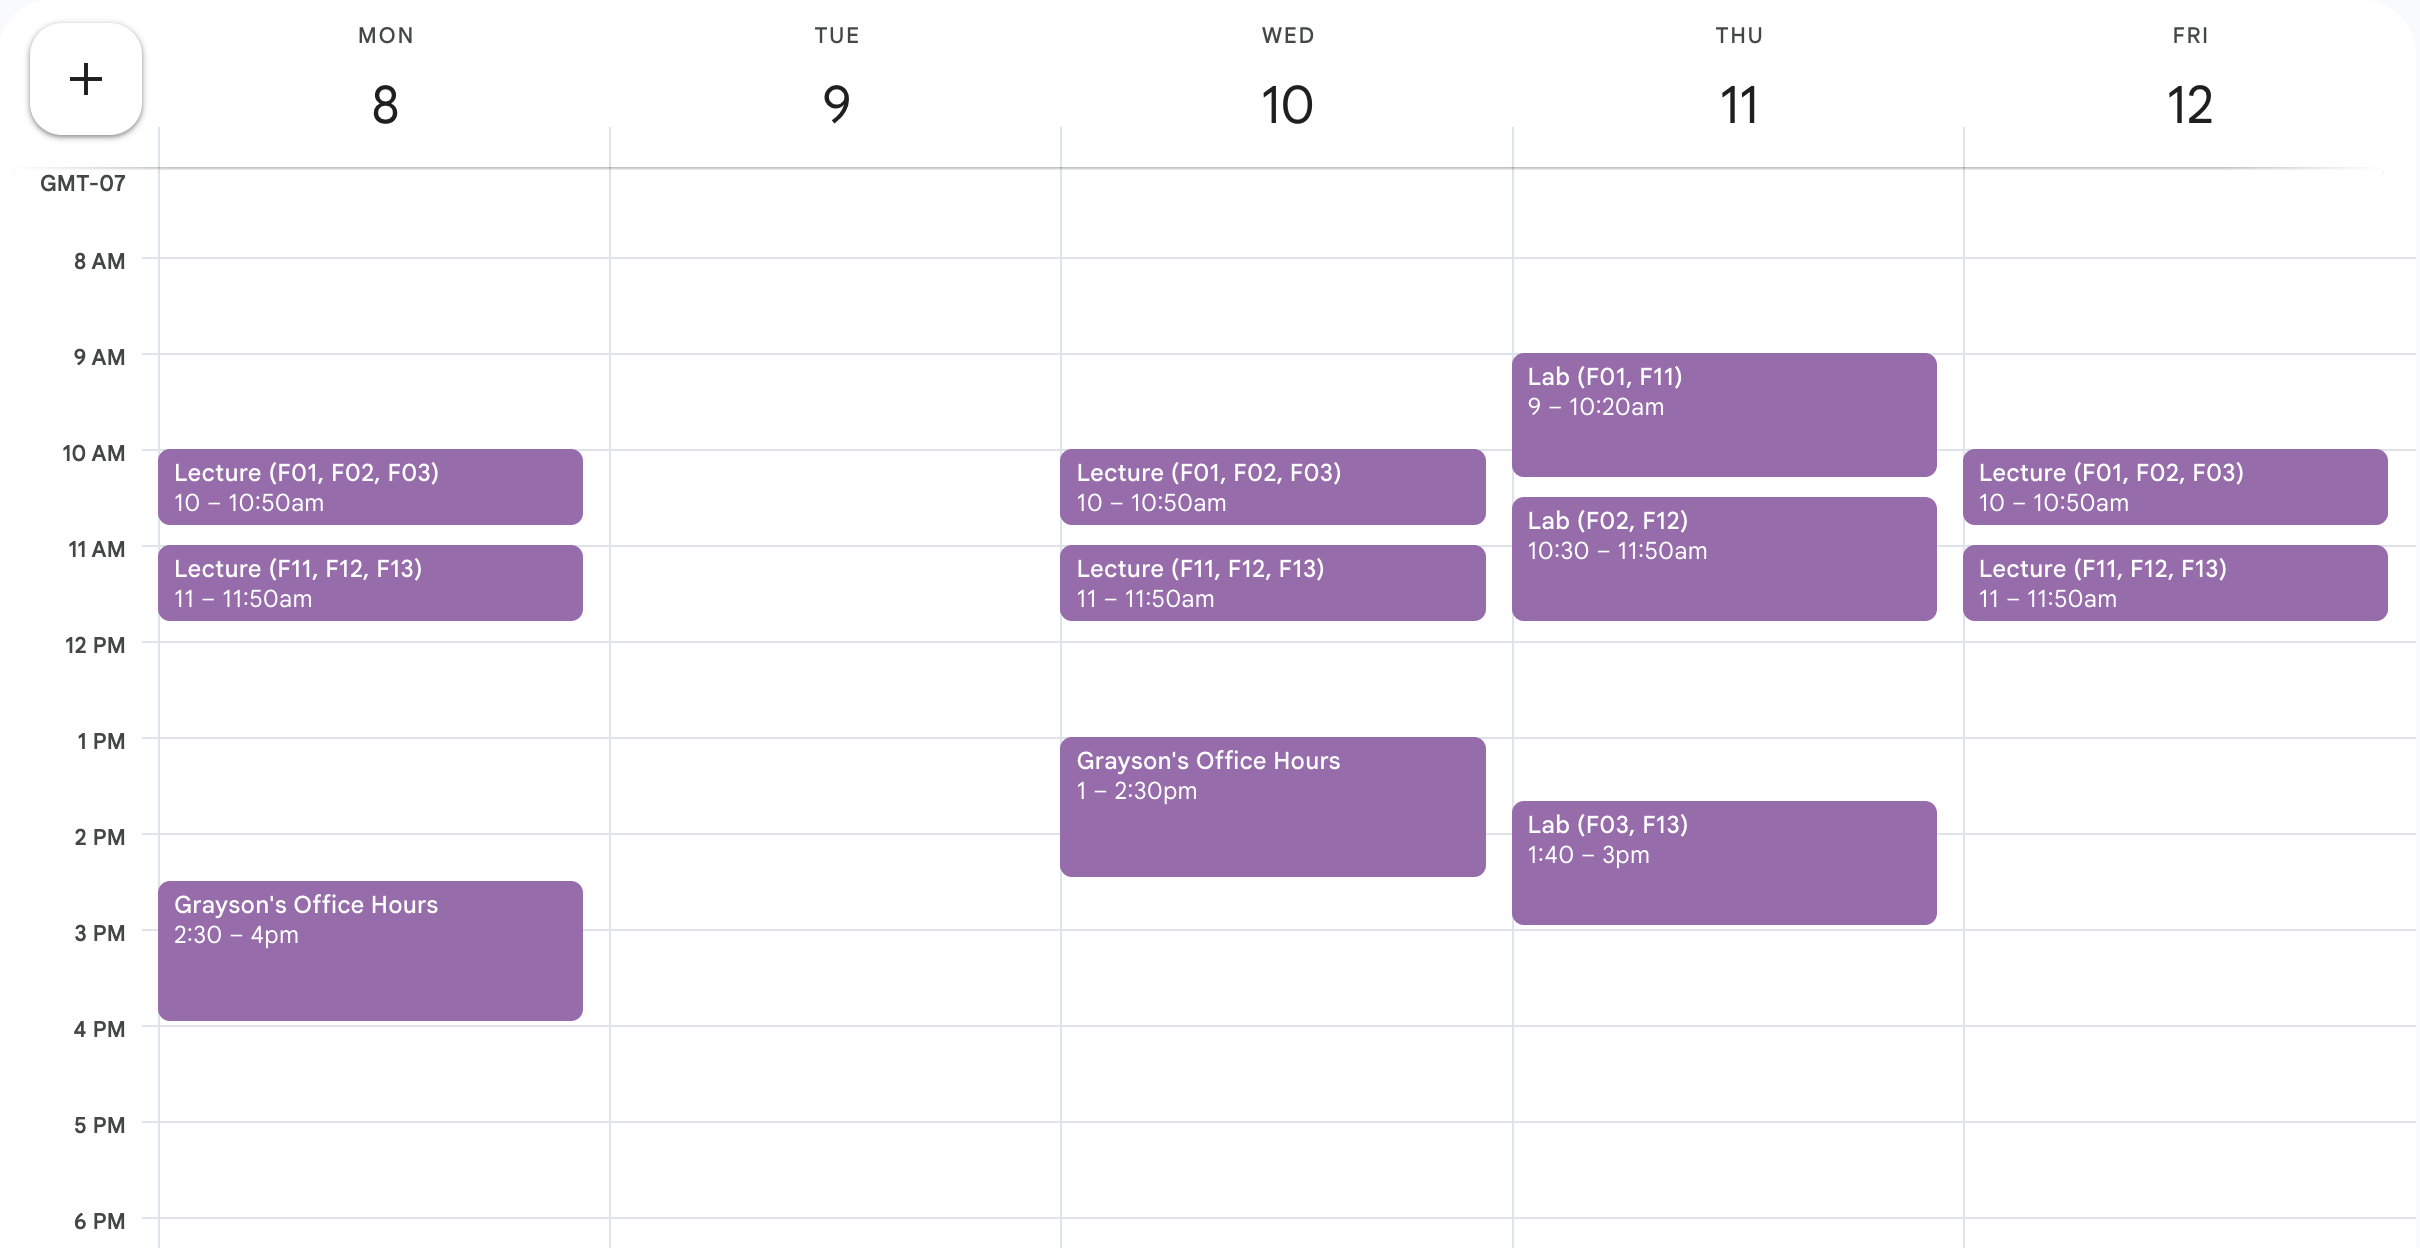
A typical day in Math 141
Learning Outcomes
In this course, you will learn how to think critically with data by engaging in the entire data analysis process.
Most of our time will be spent in the Exploration and Visualization, Data Wrangling, and Modeling and Inference steps, but we will spend some time in each cog!
- First ~3 weeks in Exploration and Visualization and Data Wrangling
- Next ~3 weeks in Modeling
- Final ~half of the course in Inference
Engagement
- Being actively present is key.
- During lecture and lab, remove distractions.
- When we are on our computers, close email, social media, news, etc.
- Hide your phone.
- I have high expectations but know that all of you (regardless of your stats, math, or computing background) have the ability to meet them.
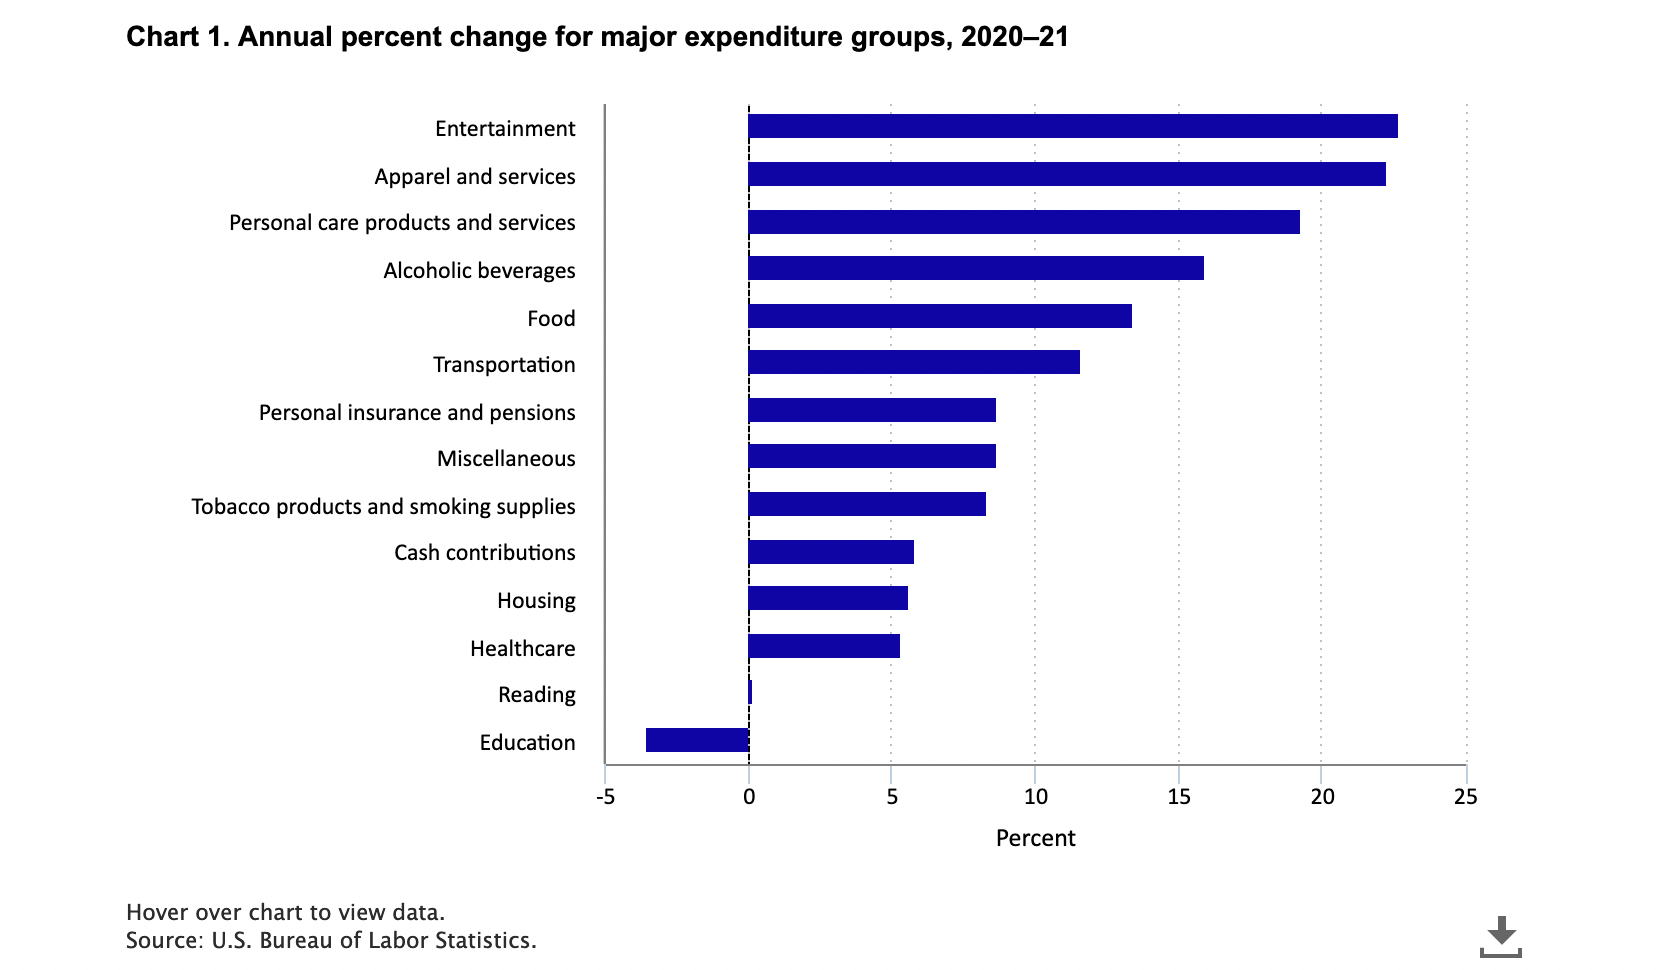
Data in Math 141
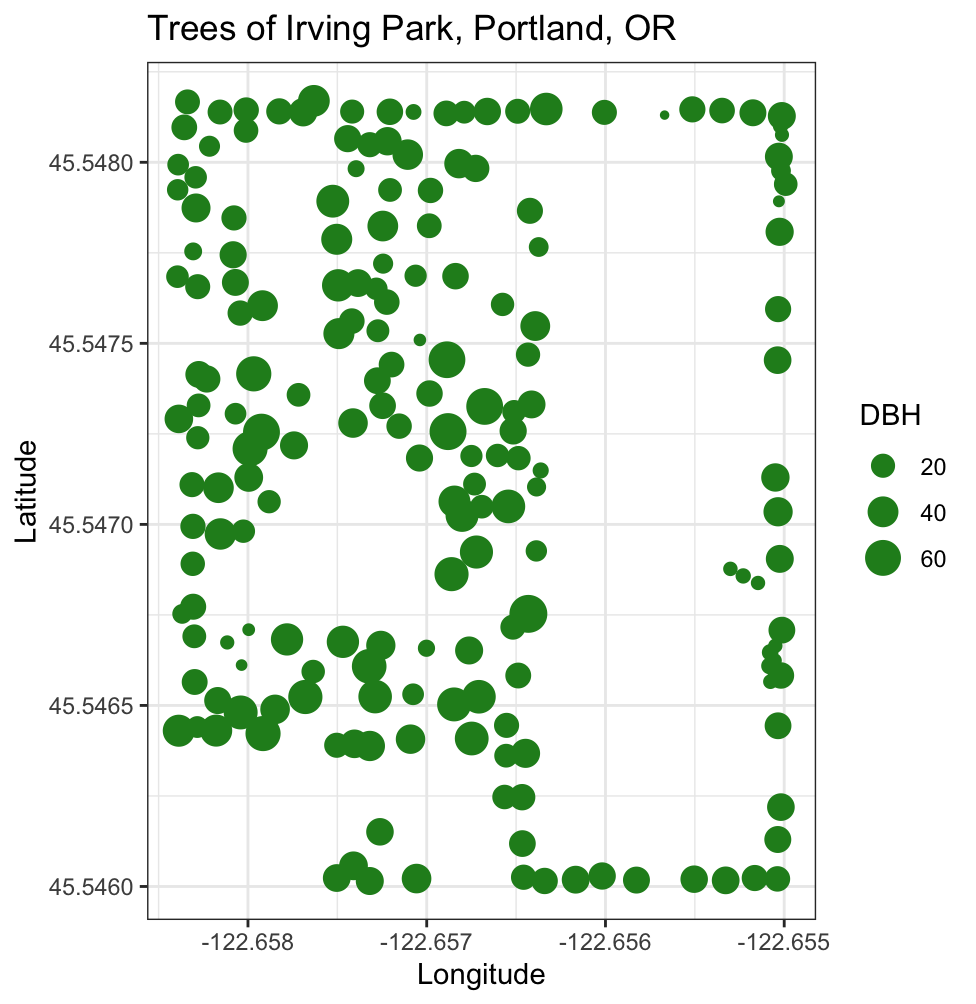
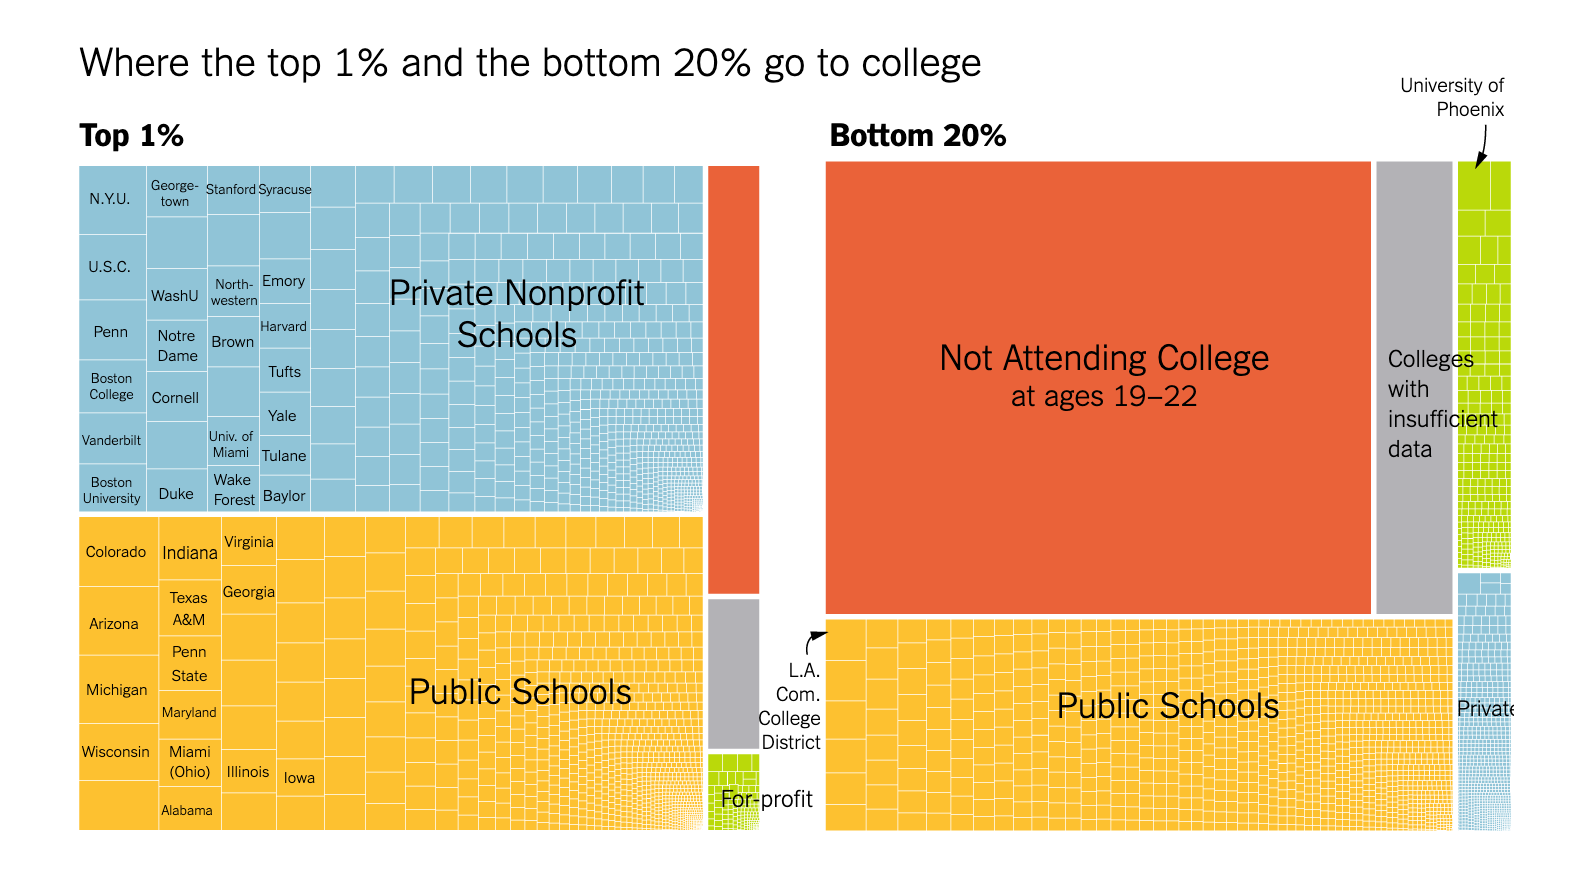
Will use a wide-range of real and relevant data examples
Data in Math 141
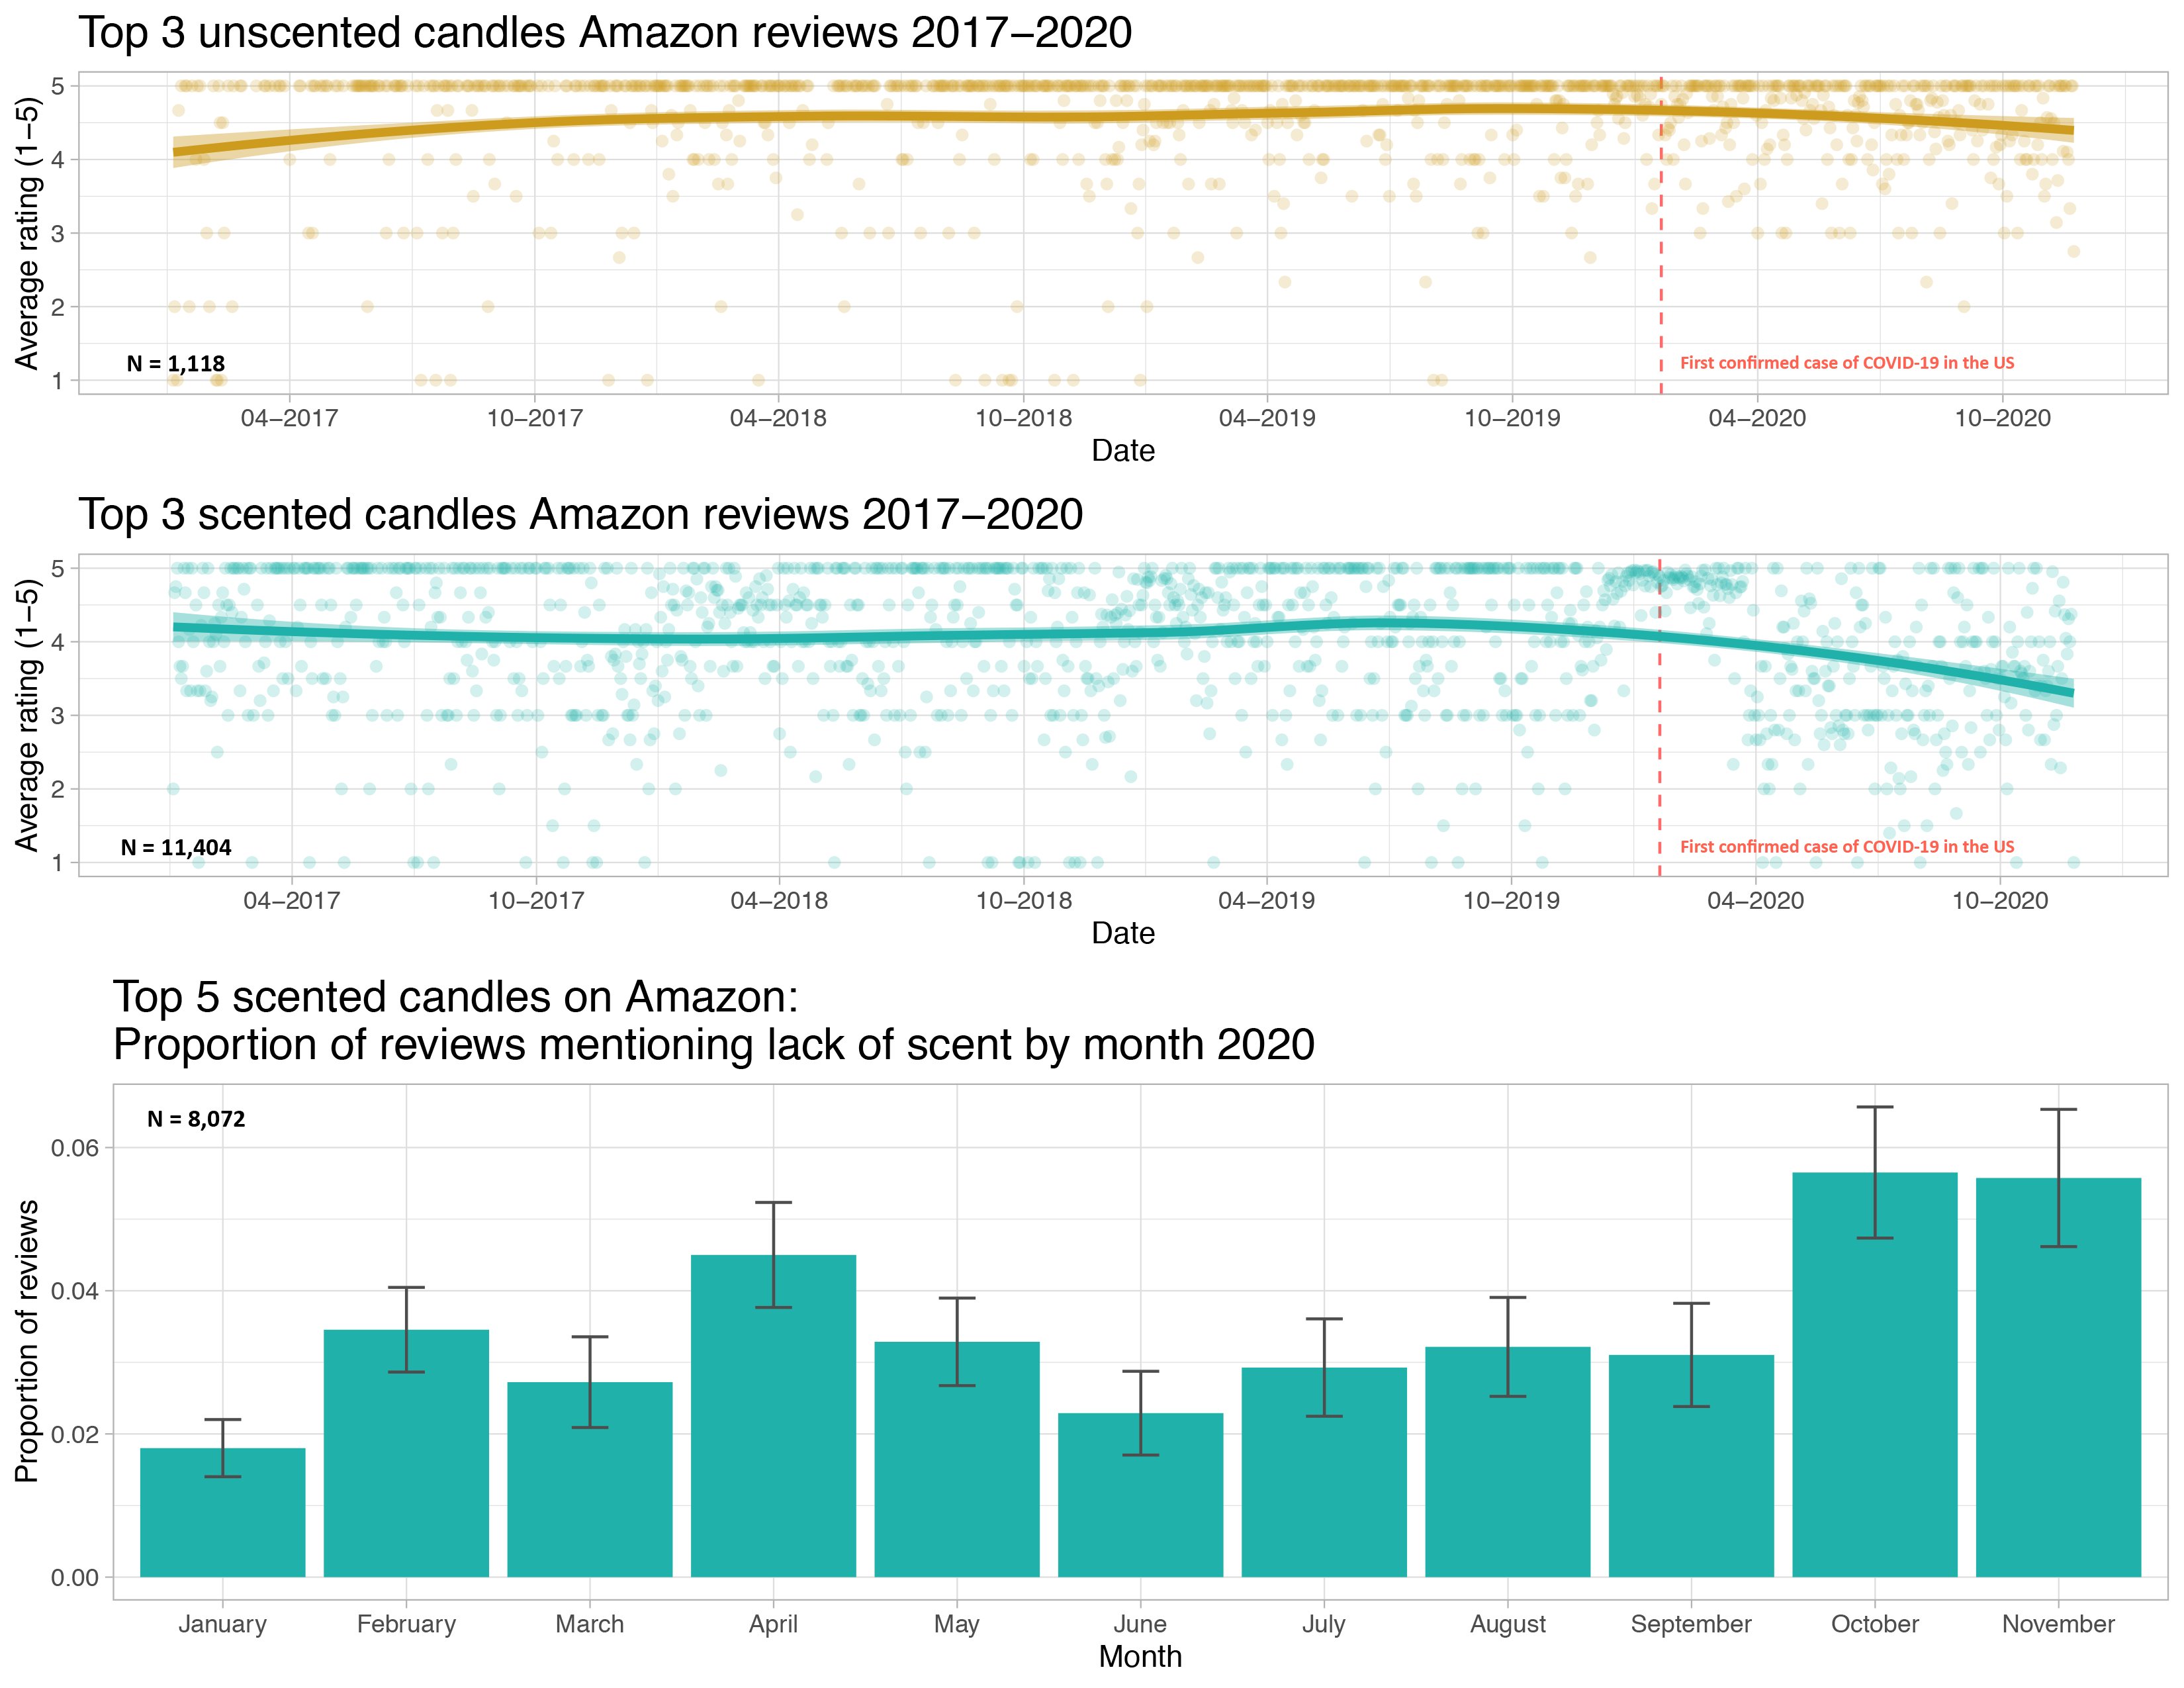
I understand that some of these topics have likely had profound impacts on your lives.
We will focus class time on the key course objectives but will use these current topics to empower ourselves and to see how we can productively participate with data.
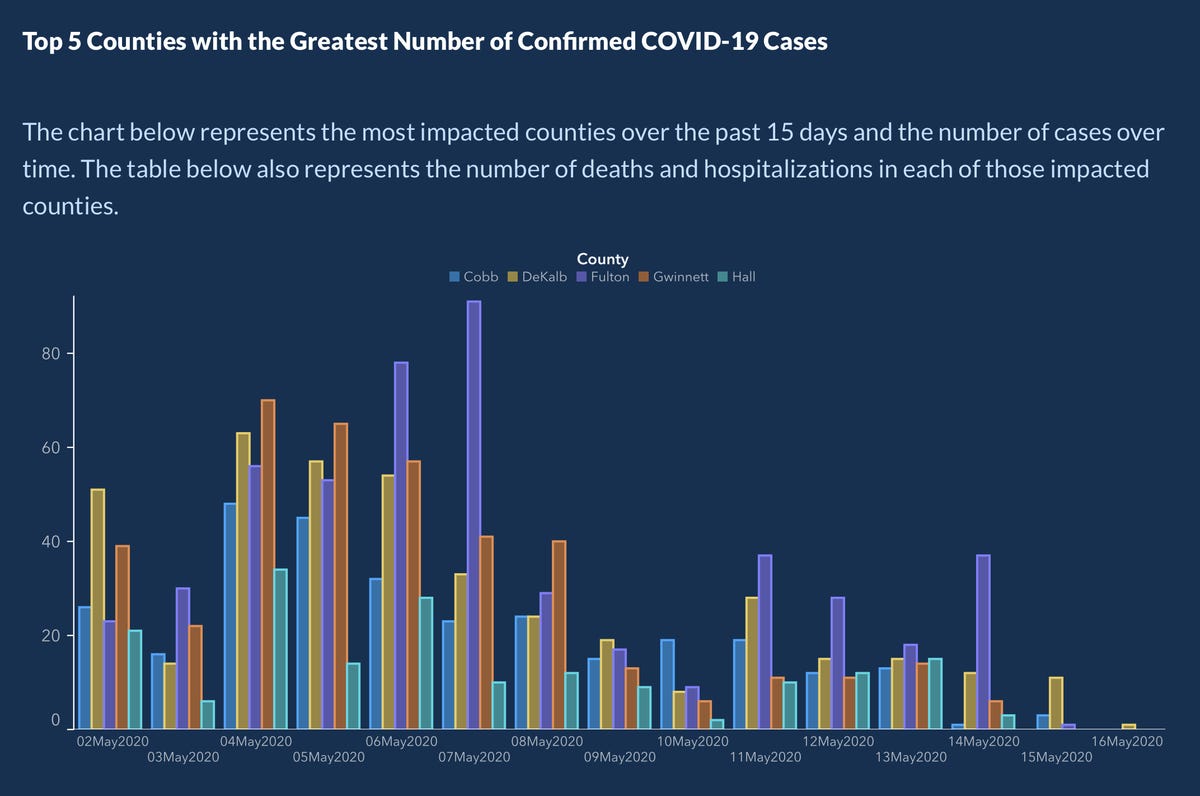
Example: Visualizing COVID Prevalence
- In May of 2020, the Georgia Department of Public Health posted the following graph:
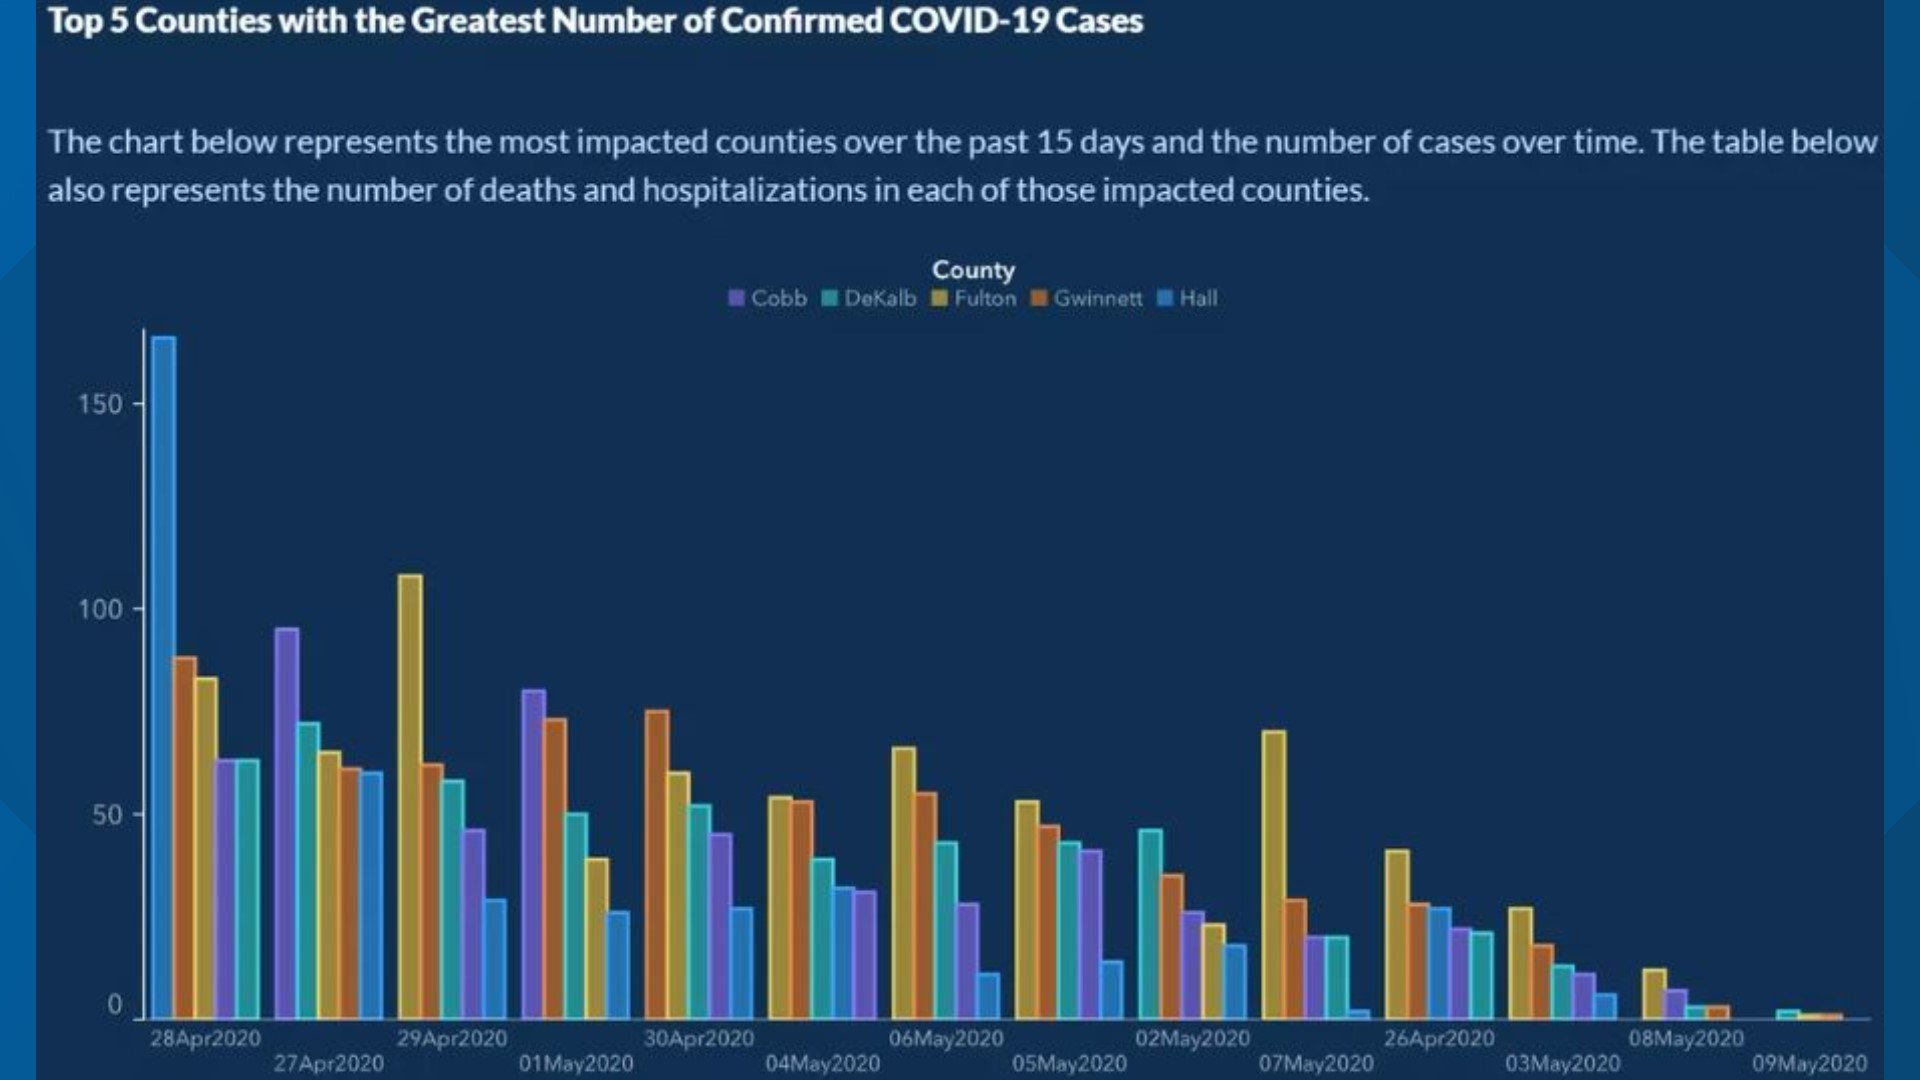
At a quick first glance, what story does the graph appear to be telling?
What is misleading about the graph? How could we fix this issue?
Example: Visualizing COVID Prevalence
- After public outcry, the Georgia Department of Public Health said they made a mistake and posted the following updated graph:
- How do your conclusions about COVID-19 cases in Georgia change when now interpreting this new graph?
Example: Visualizing COVID Prevalence
Alberto Cairo, a journalist and designer, created the second graph of the Georgia COVID-19 data:
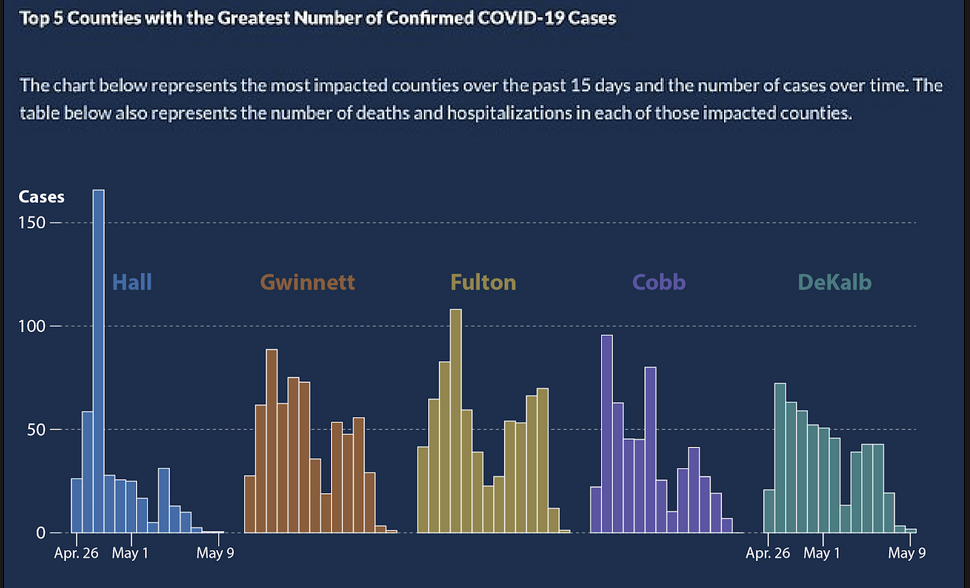
A key principle of data visualization is to “help the viewer make meaningful comparisons”.
What comparisons are made easy by the lefthand graph? What about by the righthand graph?
From these graphs, can we get an accurate estimate of the COVID prevalence in these Georgian counties over this two week period?
Next time
Problem 1 of Lab 1: Create your own Dear Data postcard!
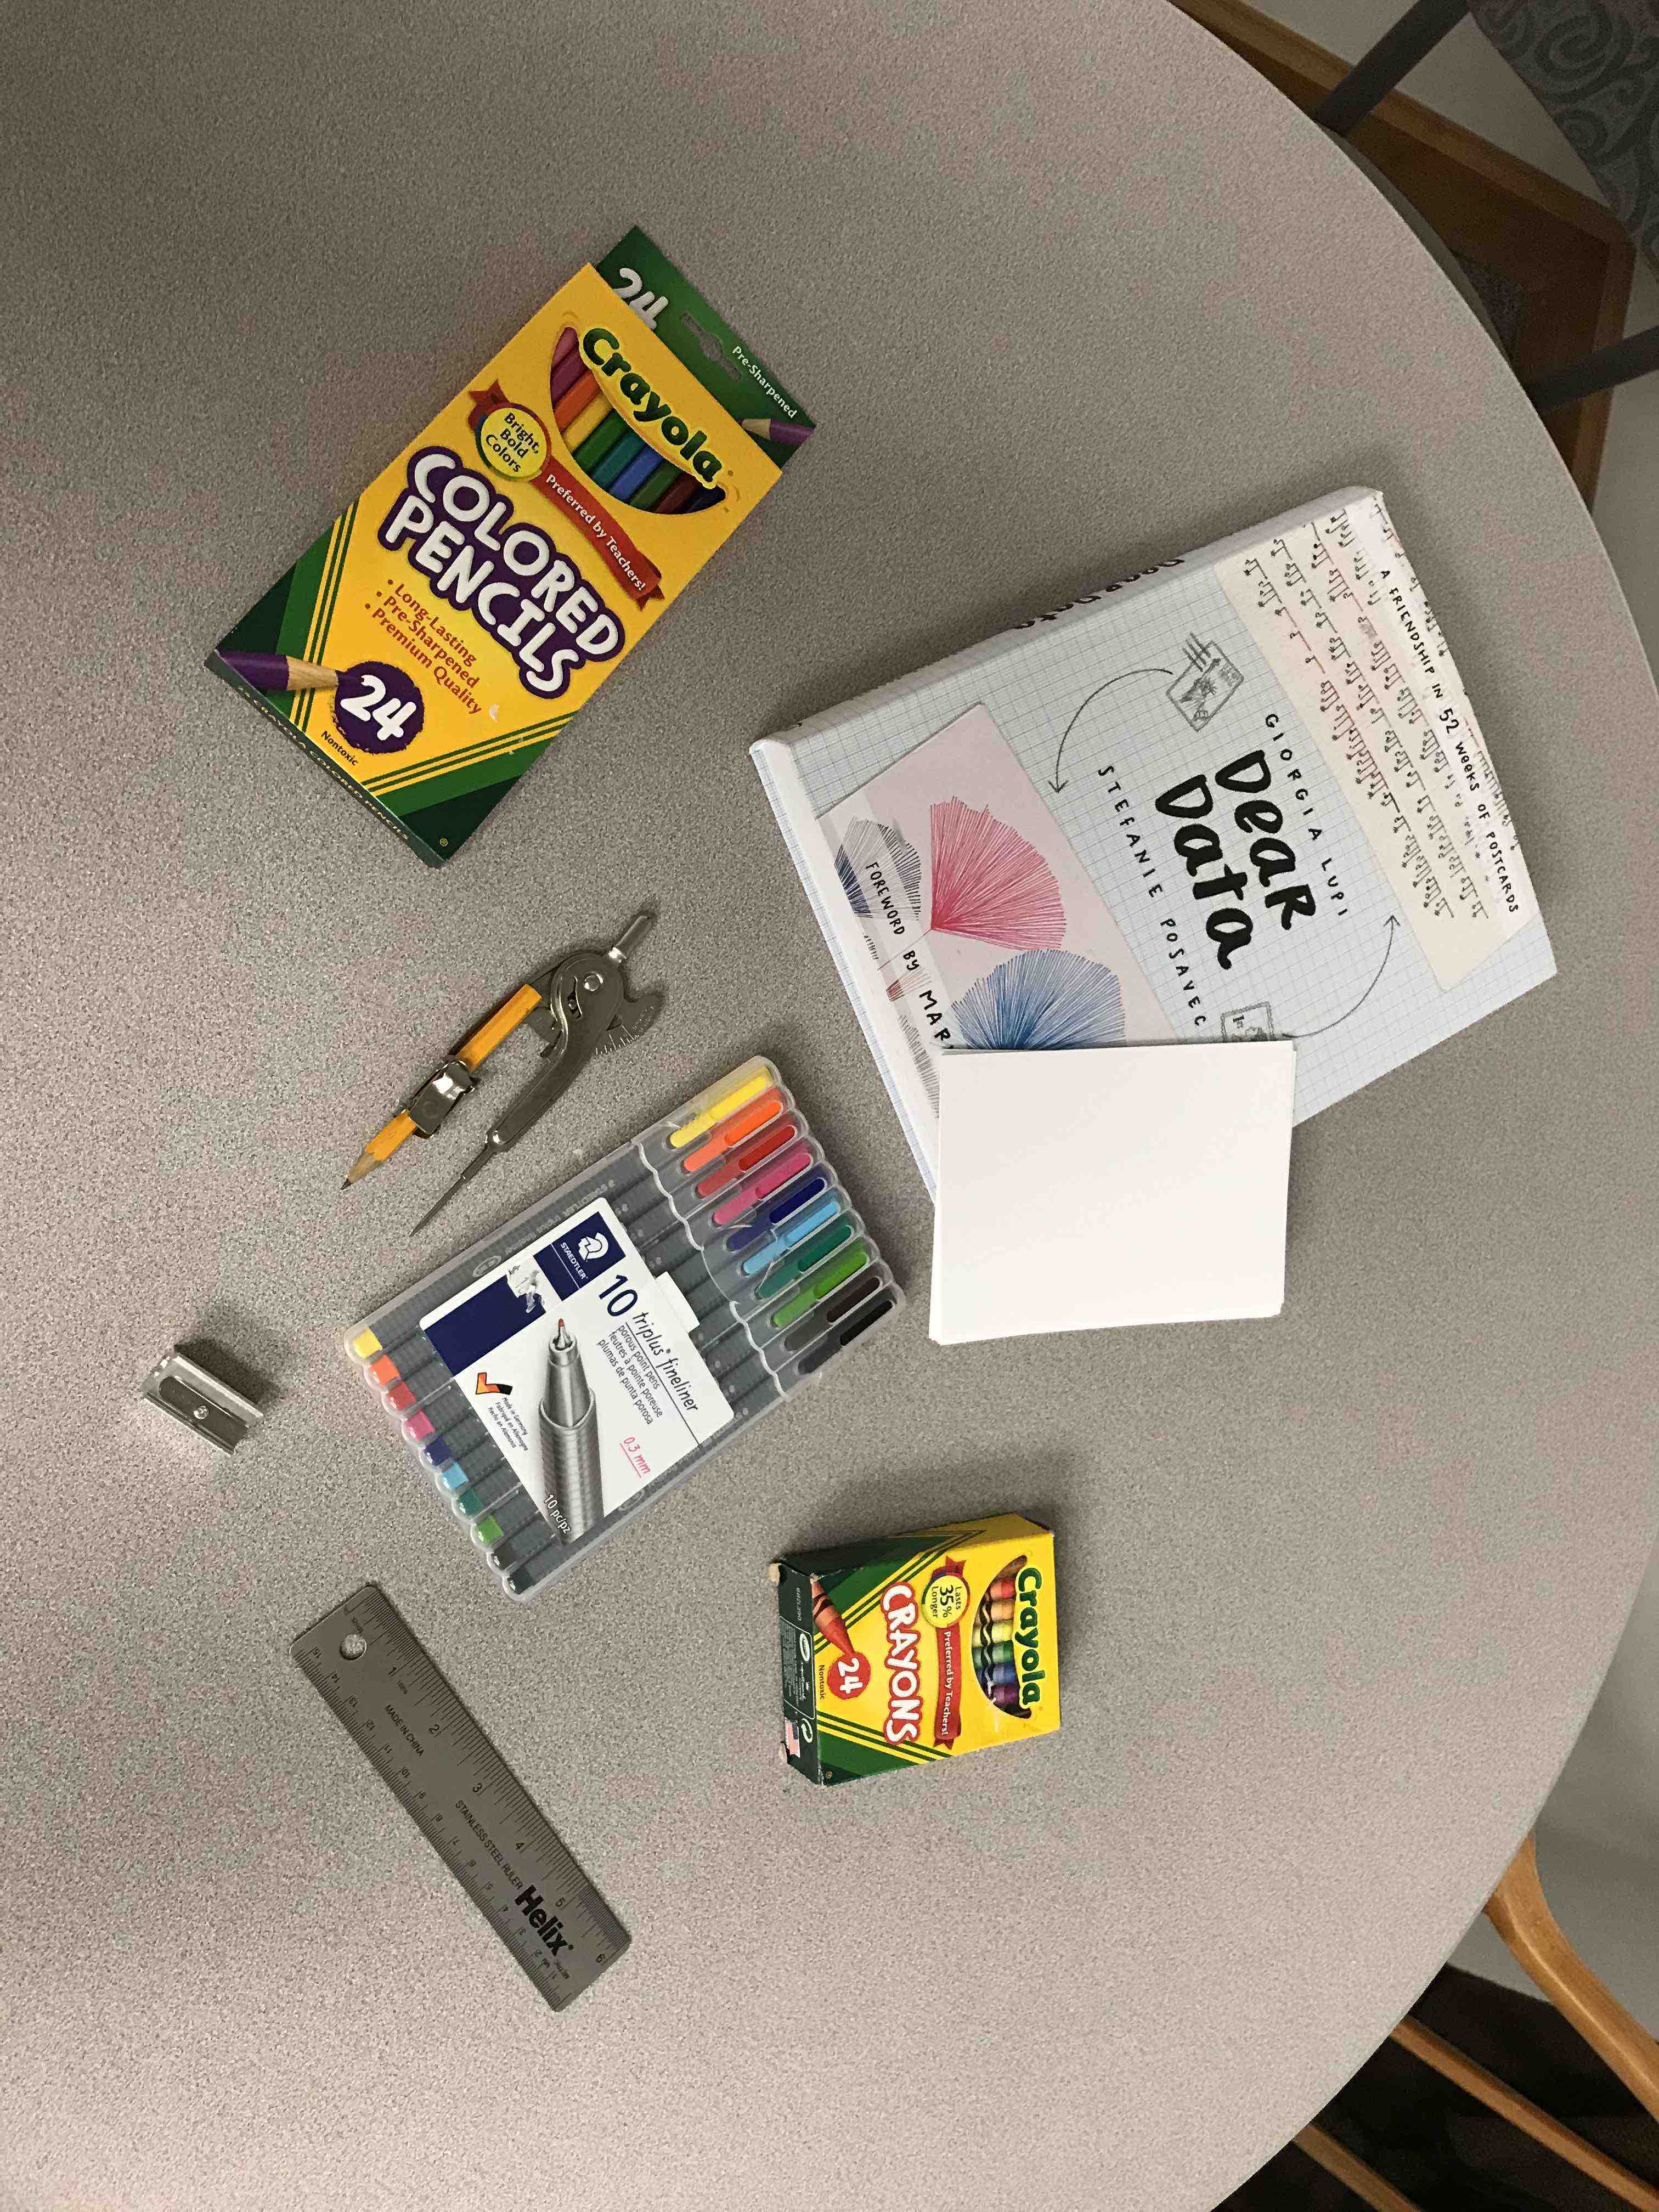
Step 1: Collect data on some aspect of your life.
Step 2: Find a story in your data and determine your postcard recipient.
Step 3: Figure out how you want to visualize the story.
Step 4+: Visualize your data on a blank postcard.
- Bring a laptop to lab tomorrow!