
P-value Pitfalls
Grayson White
Math 141
Week 9 | Fall 2025
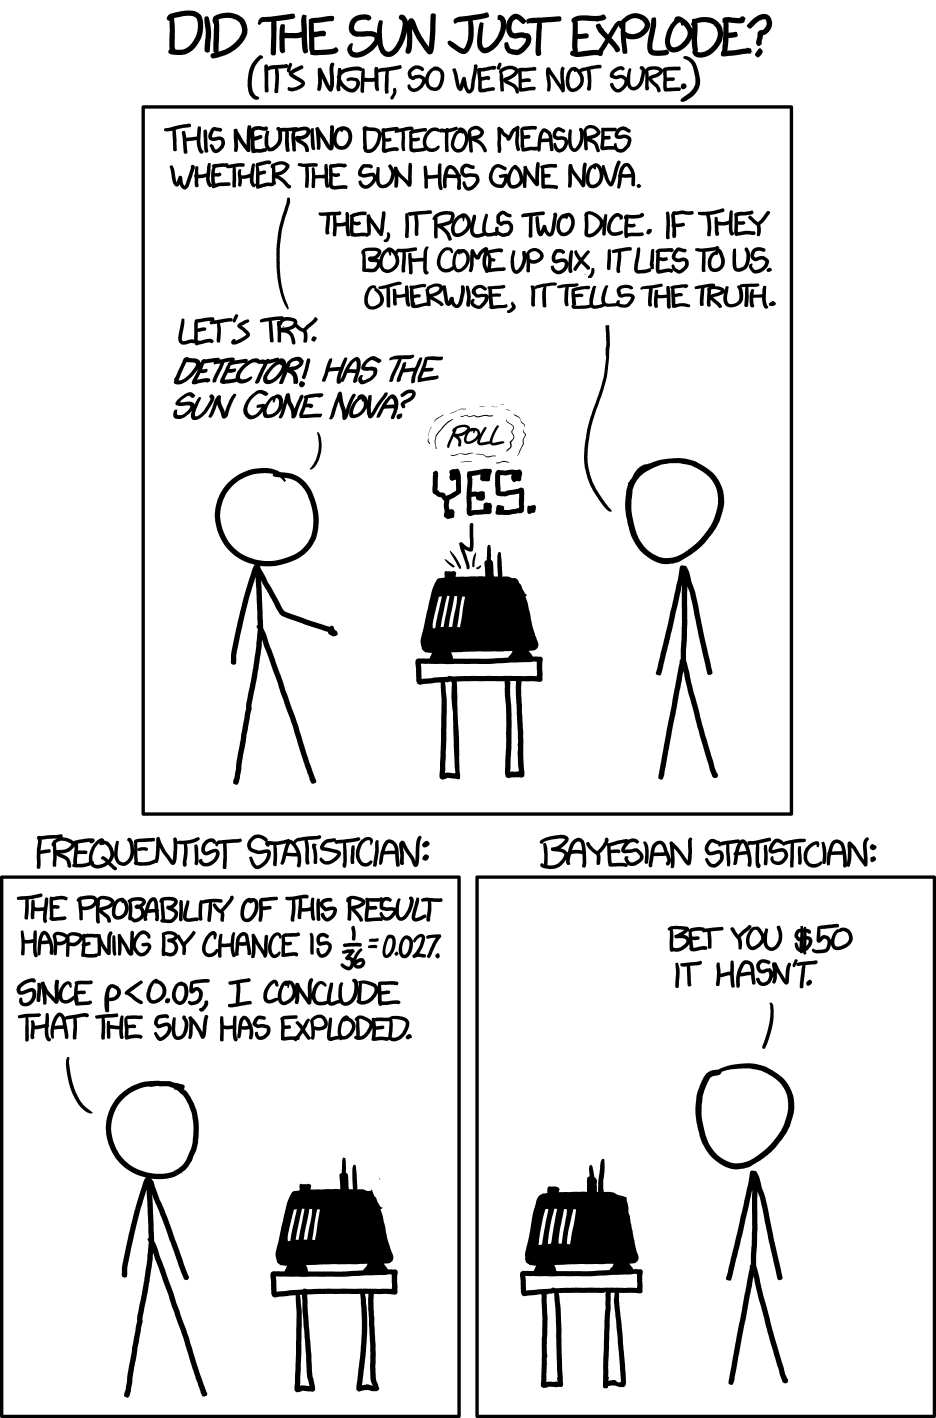
Let’s Talk About P-values
A consequence: P-hacking: Cherry-picking promising findings that are beyond this arbitrary threshold.
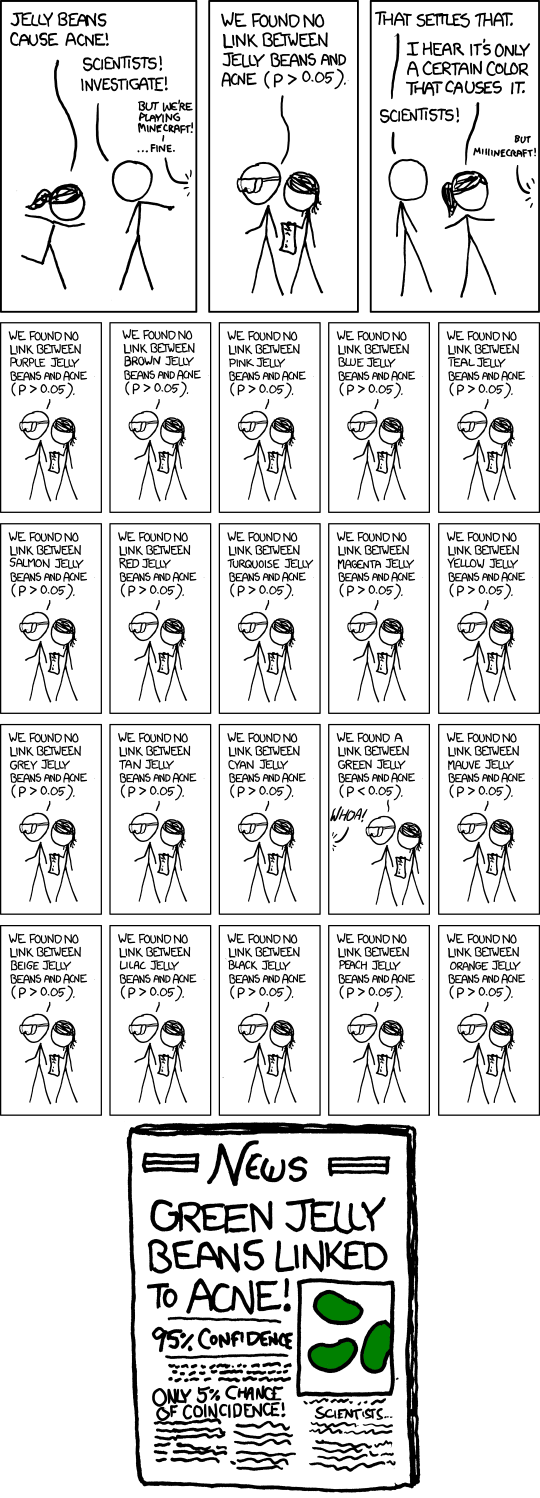
Let’s Talk About P-values
Despite its issues, p-values are still quite popular and can still be a useful tool when used properly.
In 2014, George Cobb a professor from Mount Holyoke College poised the following questions (and answers):
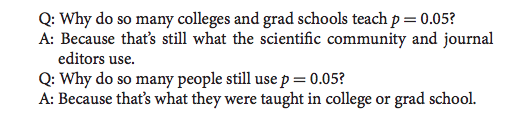
- I want us to stop this cycle.
Reporting Results in Journal Articles

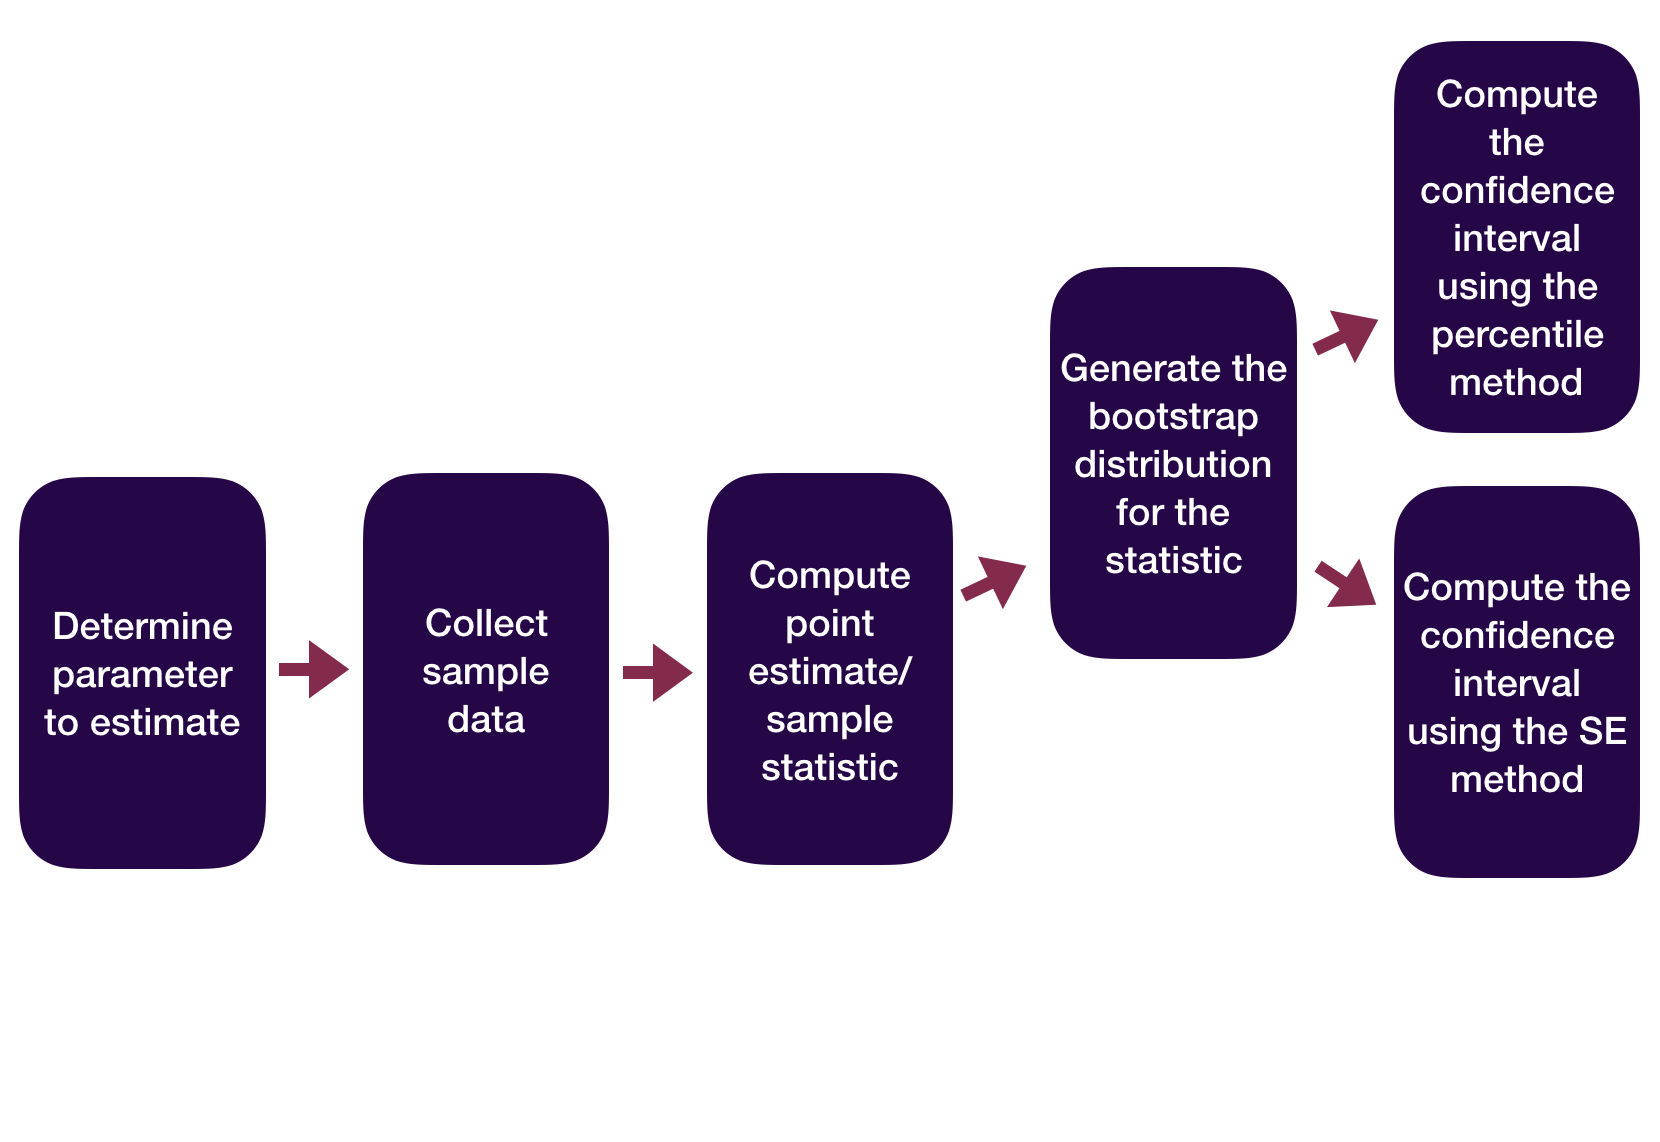
Statistical Inference Zoom Out – Estimation
Question: How did folks do inference before computers?
Statistical Inference Zoom Out – Testing
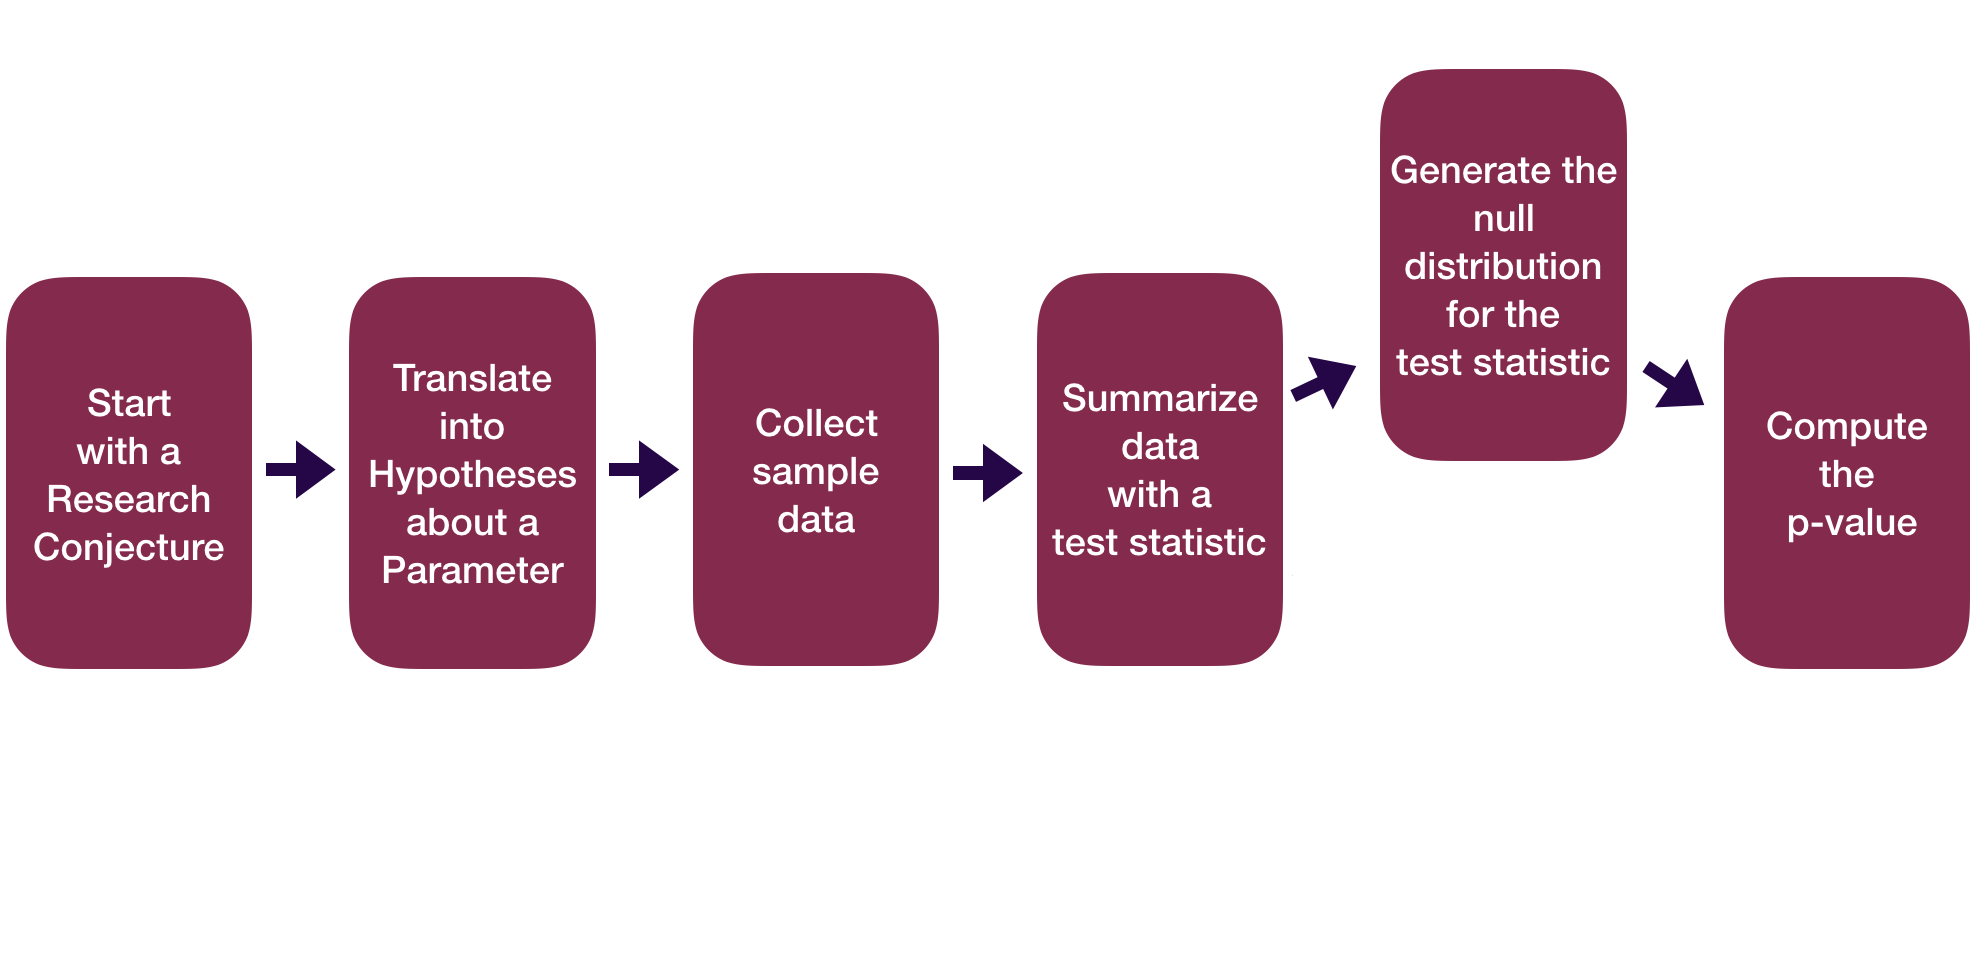
Question: How did folks do inference before computers?
Statistical Inference Zoom Out – Estimation
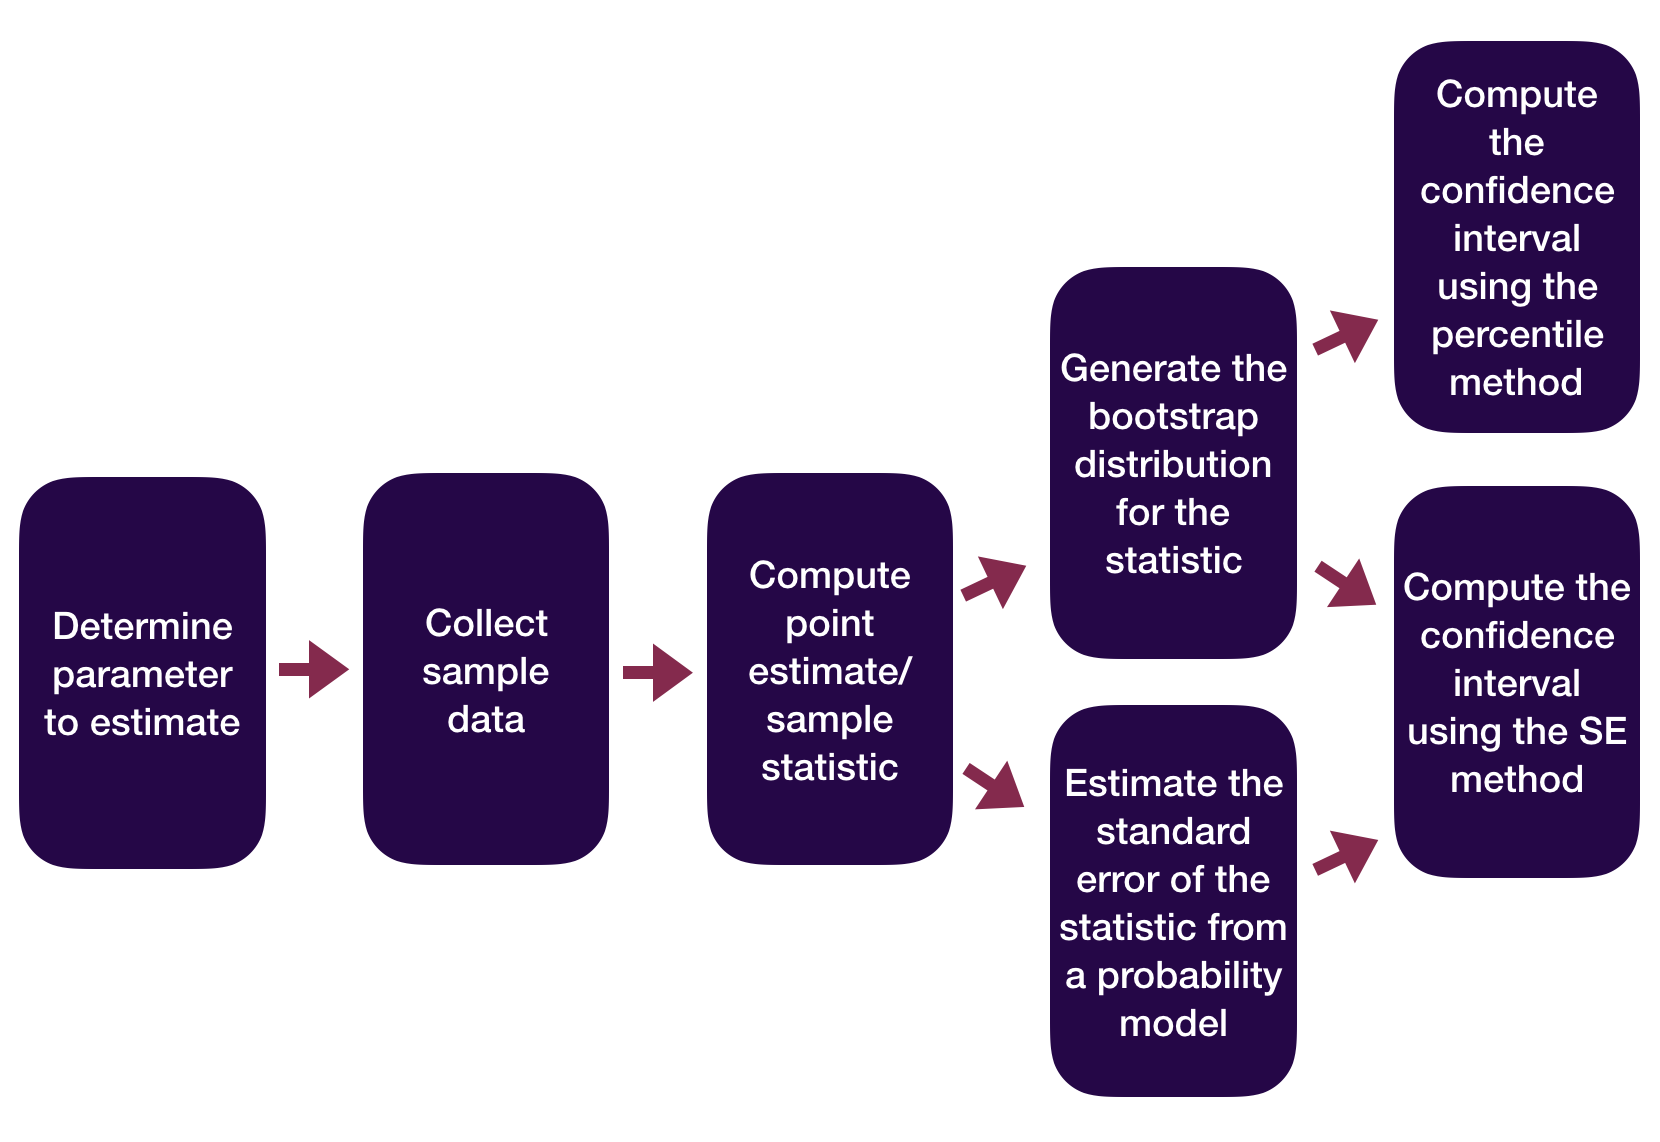
Question: How did folks do inference before computers?
Statistical Inference Zoom Out – Testing
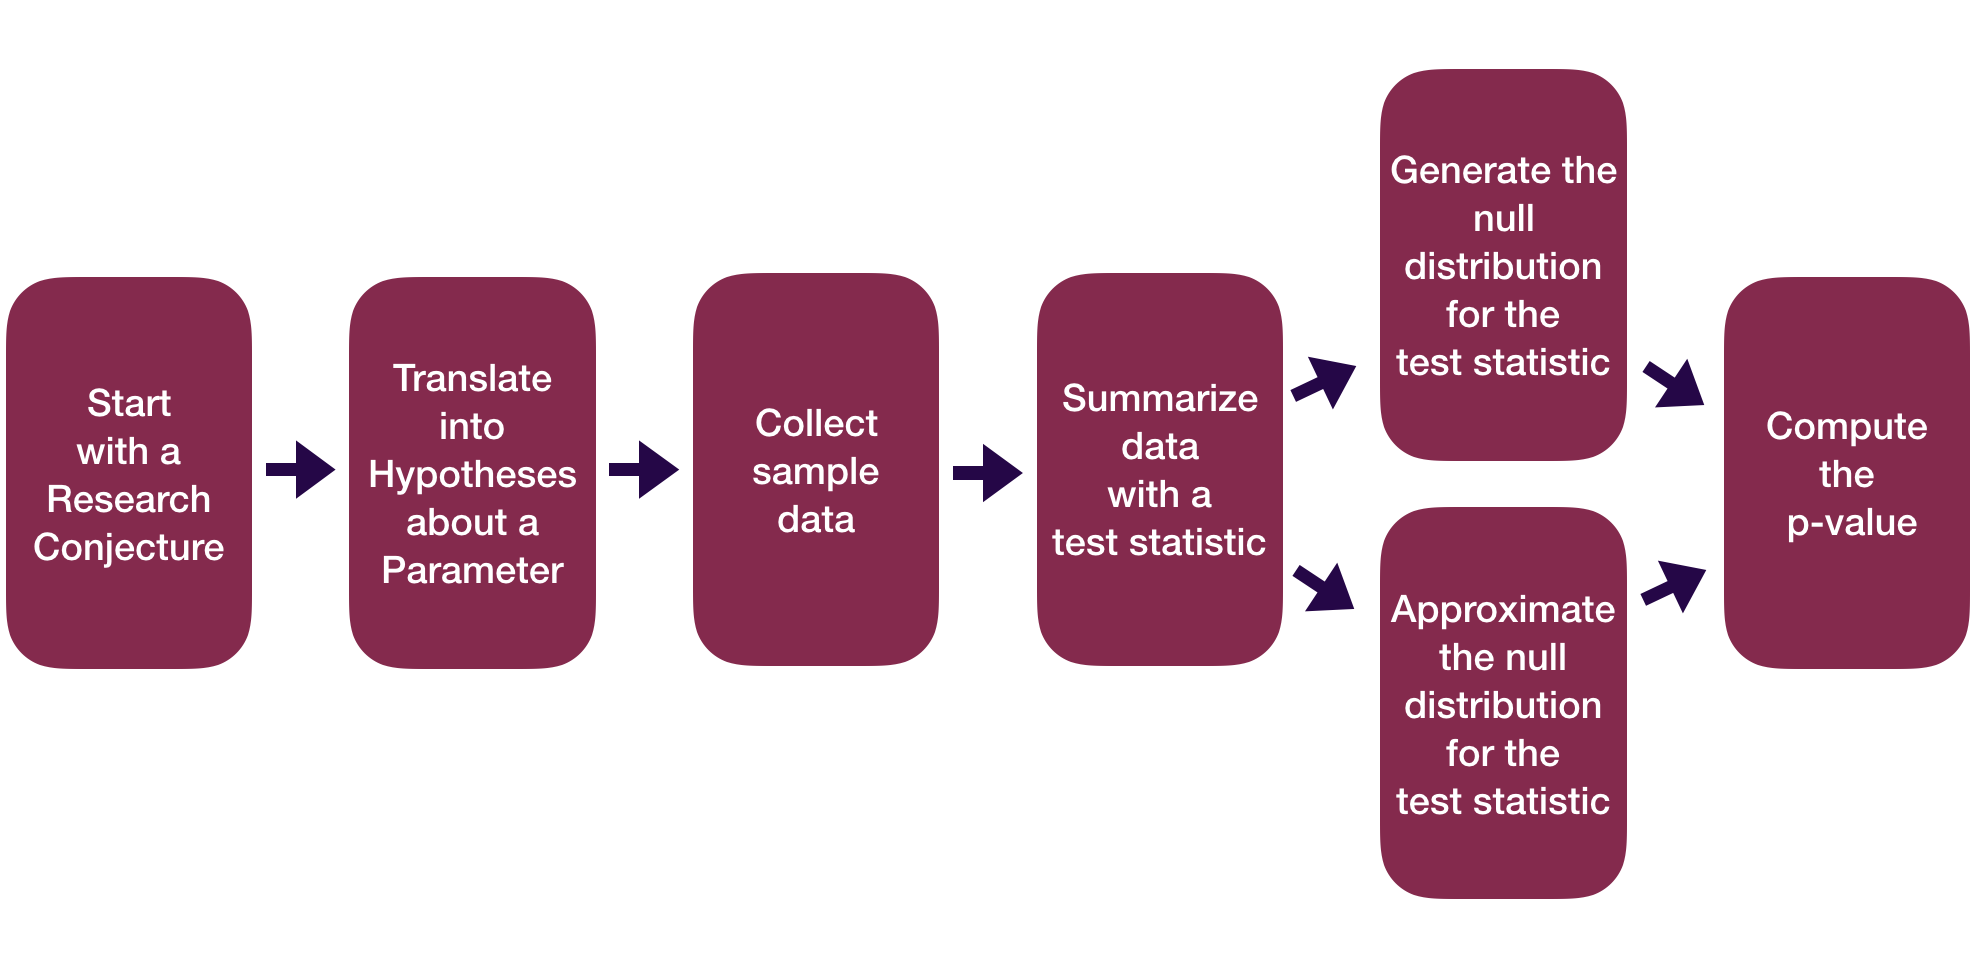
Question: How did folks do inference before computers?
Probability Models
“All models are wrong but some are useful.” – George Box
Question: How can we use theoretical probability models to approximate our (sampling) distributions?
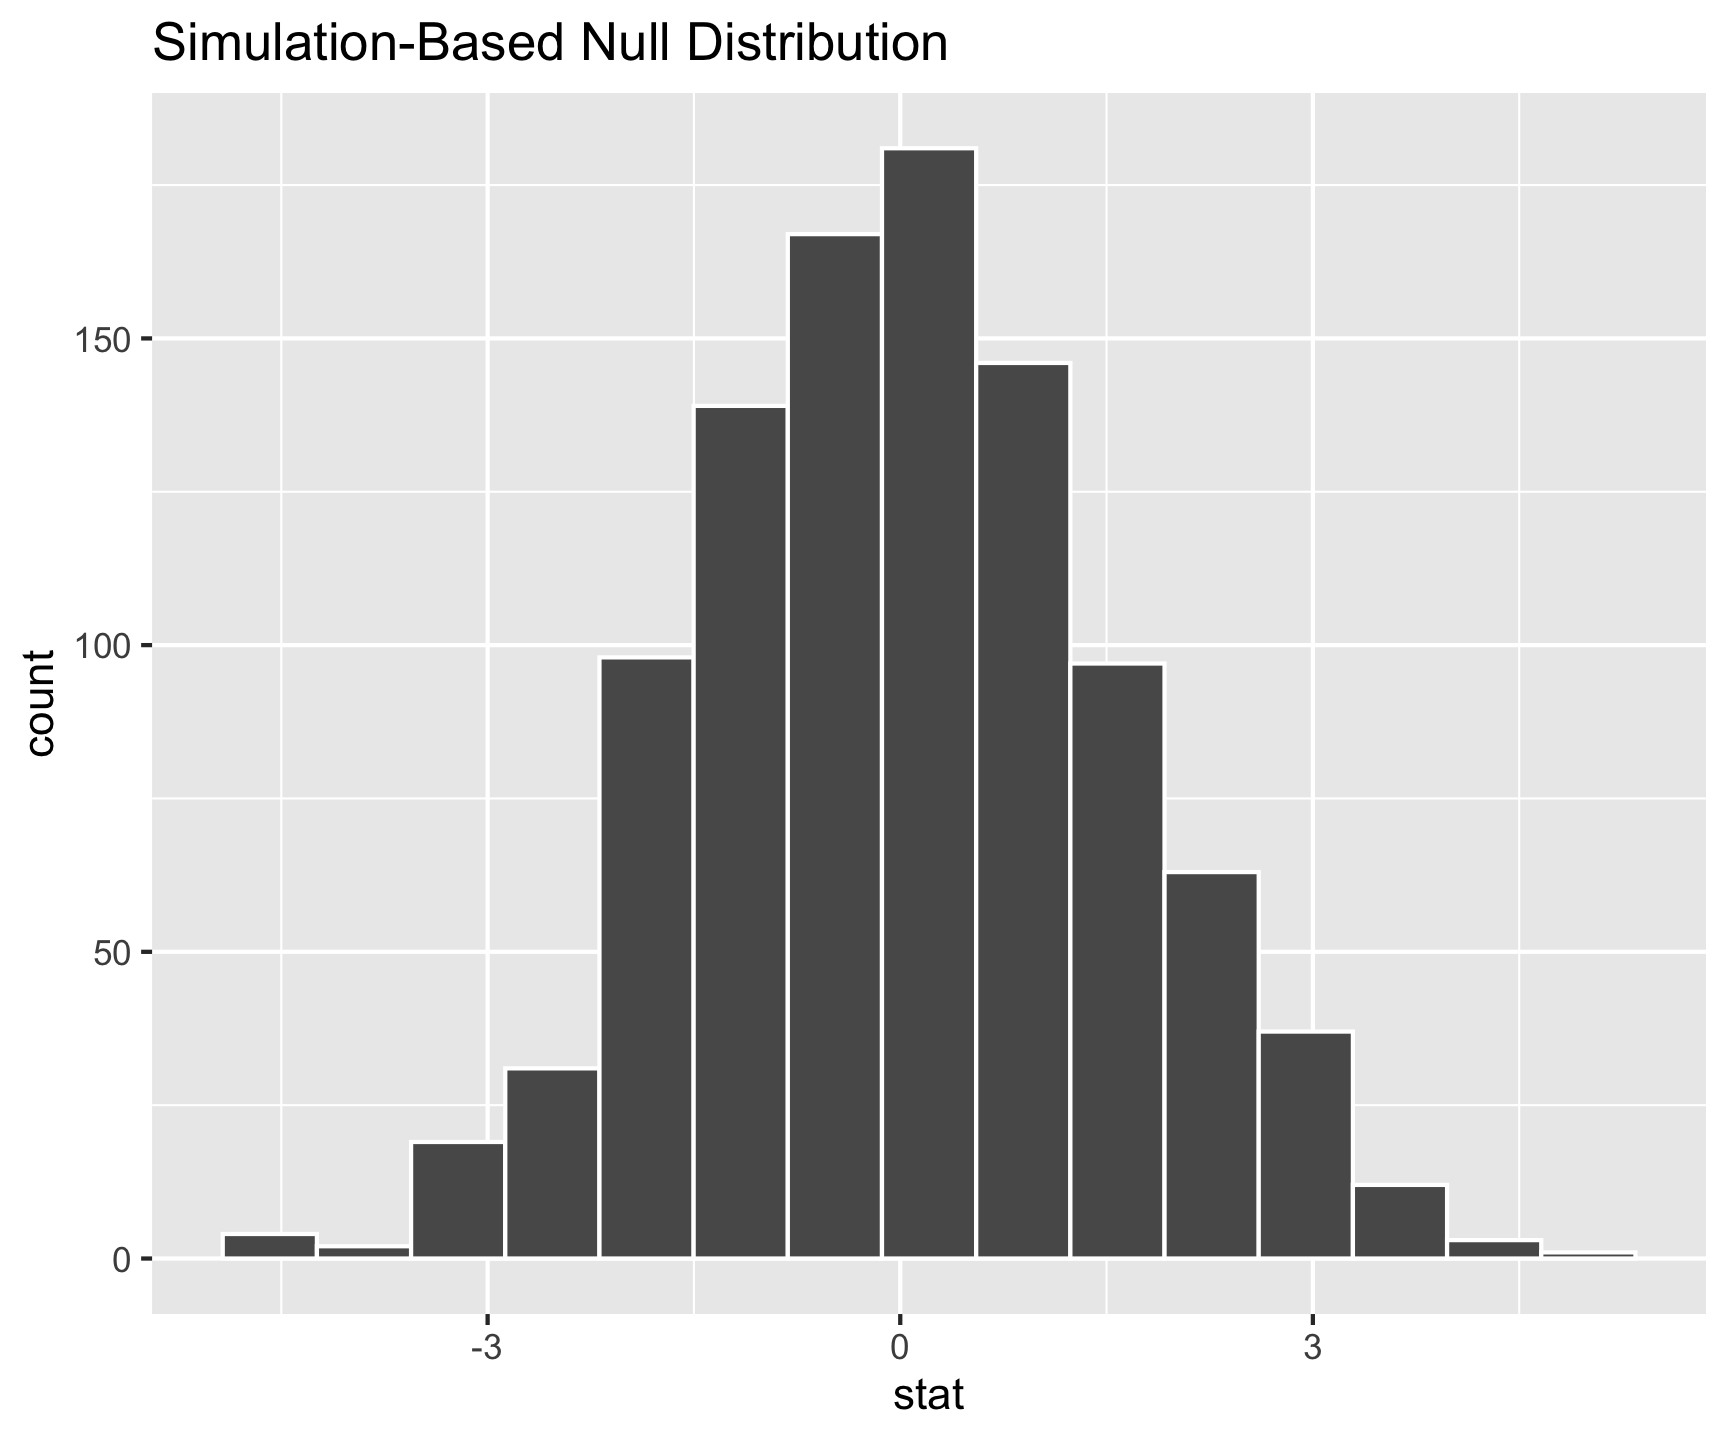
Before we can answer that question and apply the models, we need to learn about the theoretical probability models themselves.