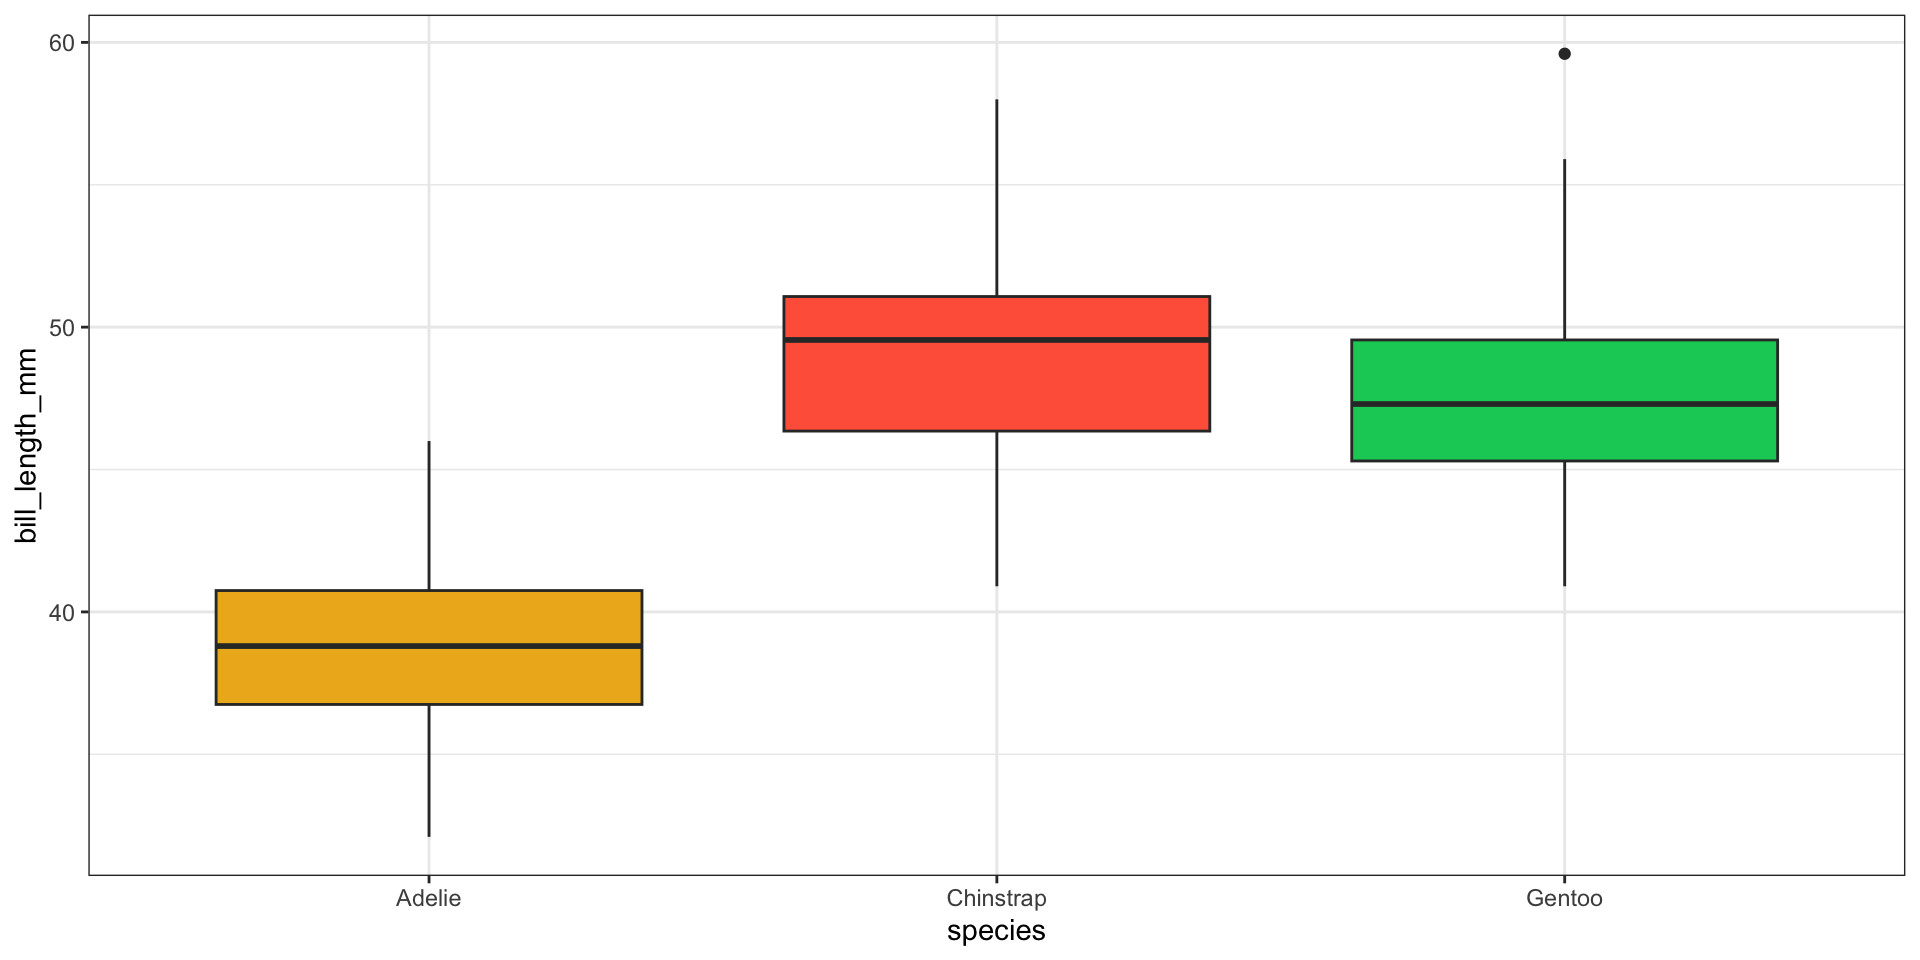
Statistical Inference: Big Picture


Grayson White

Math 141
Week 13 | Fall 2025

Goals for Today

  • Discuss final exam logistics
  • Big picture of inference (and regression review)
  • But first….
    • Faculty evaluations!

Final exam info + logistics

  • Our final will occur on during finals week.
  • Two components: an in-person written exam, and an in-person oral exam
  • Oral component
    • To be completed on Monday or Tuesday of finals week (Dec 15 or 16), in Library 390 (my office).
    • No resources are allowed for the oral exam, except for your final exam review problems.
    • Will include questions about the content of the final exam review problems, and/or conceptual/interpretive questions from the course generally.
    • 10 minutes long (12 minute appointments for transition buffer).
    • Sign up for oral exam times are first come first serve. If you have extended time on exams, you must sign up for 2 consecutive slots.
    • Oral exam signup link is available on the course website.

Final exam info + logistics

  • Written component
    • Will occur in Vollum Lecture Hall, on Wednesday, December 17, from 6pm - 9pm.
    • The exam is closed book/notes/resources, except for the following materials: content on the course website, an 8.5”x11” “cheatsheet” (this must be on a physical piece of paper out but does not need to be handwritten). You can also use the R help files (for example, by running ?function_name in the console).
    • You have 3 hours to complete the written component of the exam. You must use this time consecutively.
    • You may not collaborate or consult with others about the exam. You may not use generative AI or any resources outside of the ones listed above.

Final exam questions?

Statistical Inference: Big Picture

Exploratory Data Analysis

penguins %>%
  ggplot(aes(x = species, y = bill_length_mm, fill = species)) + 
  geom_boxplot() + 
  scale_fill_manual(values = c("goldenrod2", "tomato", "springgreen3")) + 
  theme_bw() + 
  guides(fill = "none")
Warning: Removed 2 rows containing non-finite outside the scale range
(`stat_boxplot()`).

Exploratory Data Analysis

penguins %>%
  drop_na(species, bill_length_mm) %>%
  ggplot(aes(x = species, y = bill_length_mm, fill = species)) + 
  geom_boxplot() + 
  scale_fill_manual(values = c("goldenrod2", "tomato", "springgreen3")) + 
  theme_bw() + 
  guides(fill = "none")

(More) Exploratory Data Analysis

penguins %>%
  drop_na(species, bill_length_mm) %>%
  group_by(species) %>%
  summarize(avg_bill_length_mm = mean(bill_length_mm),
            number_of_penguins = n())
# A tibble: 3 × 3
  species   avg_bill_length_mm number_of_penguins
  <fct>                  <dbl>              <int>
1 Adelie                  38.8                151
2 Chinstrap               48.8                 68
3 Gentoo                  47.5                123